- Last full trading week ahead of crucial US presidential elections
- Virus package unlikely currently
- American daily virus cases reach another record
- Democrats are fighting for a bigger stimulus package, and
- If the President and Democrats take control of both houses, it will make it very easy for them to govern which is crucial during a crisis.
- The Democrats, who have been fighting for a bigger stimulus, will have the votes to approve any size stimulus they want, and
- There will be an ability to govern with stability amid the worst global crisis since the two World Wars. Such a win is expected to boost risk assets, while havens like the dollar would fall out of favor.
- Futures on the S&P 500 Index dipped 1%.
- In Europe, the Stoxx 600 Index fell 0.8%.
- The MSCI Asia Pacific Index dipped 0.3%.
- The MSCI Emerging Markets Index declined 0.3%.
- The Dollar Index climbed 0.3% to 93.03.
- The euro fell 0.3% to $1.1827.
- The British pound declined 0.3% to $1.3008.
- The Japanese yen weakened 0.2% to 104.87 per dollar.
- The yield on 10-year Treasuries declined four basis points to 0.80%.
- The yield on two-year Treasuries declined one basis point to 0.15%.
- Germany’s 10-year yield declined two basis points to -0.59%.
- Britain’s 10-year yield fell three basis points to 0.252%.
- West Texas Intermediate crude decreased 3.2% to $38.49 a barrel
- Gold weakened 0.2% to $1,898.64 an ounce.
Key Events
US contracts on the Dow, S&P, NASDAQ and Russell 2000 retreated and European stocks, including the Stoxx 600, fell to a month’s low on Monday, at the start of a busy earnings week as US COVID-19 cases hit an-all time high for the second day in a row.
Global Financial Affairs
Last week, the bulls' grip slipped from a rally that had lasted three straight weeks. The most visible driver was the continued ups and downs of stimulus talks ahead of the fast-approaching Nov. 3 elections.
US yields reached their highest in four months as traders bet that former Vice President Joe Biden will win the Presidency and Democrats will win both the Senate and Congress. This emboldened bulls for two reasons:
Although stocks closed lower for the week, economic data was encouraging to the long-term outlook, as jobless claims fell, and housing market expanded.
The S&P 500 receded 0.53% last week, after a more than 10% move from the low of Sept. 24 and the high of Oct. 12, but the drop should not be considered a decline. The index behaved in an orderly fashion, fluctuating in a narrow band, showing demand was still robust, propping up prices. Let’s see what that looks like on the chart.
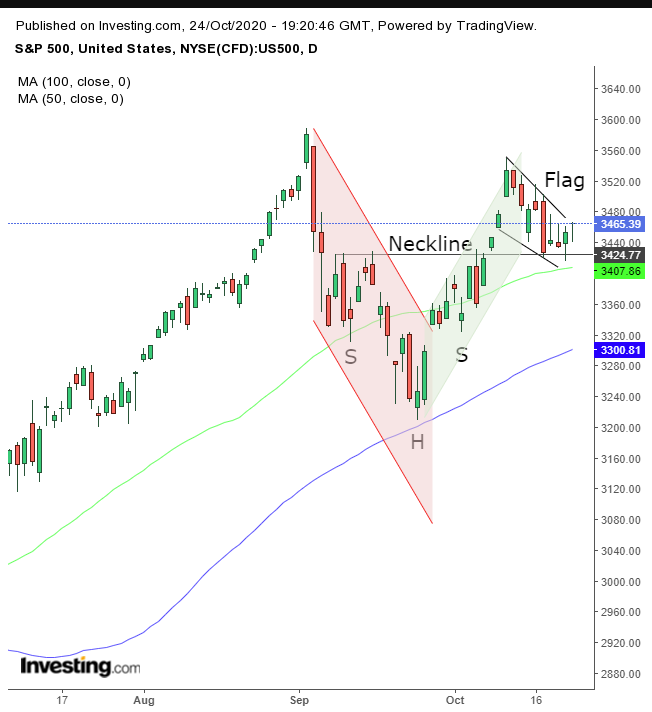
The stock index has been trading within a falling flag—a tight range with a downward bias. While its declining fashion may strike an inexperienced observer as bearish, it is a good thing. It shows that sellers are selling all their contracts, and the gauge is still not falling, because there is sufficient demand to absorb it. That’s why it’s considered a bullish pattern, but a buy signal is given only after an upside breakout.
But this isn’t just a bullish flag, it follows a H&S bottom, which shows that after sellers dictated the trend, buyers took over and pushed it back up—a bullish pattern.
Mapping The Chart
Moreover, we don’t just have two bullish patterns one after the other, but the flag has found support at the neckline of the H&S bottom—the highs of the bottom—demonstrating its support. In this way, the two patterns are working together, both confirming the bullishness of the other.
Note, that the 50 DMA supports the flag, and the 100 DMA supports the H&S bottom.
Bottom Line
While these two intertwined patterns provide a very bullish outlook, the fact that it is only one week before the US Presidential election means stocks are moving in a range which may demonstrate that investors are waiting for the voting outcome for an explosive move. These elections are more momentous than any in memory as they are taking place against the backdrop of a global pandemic which has resulted in House Republicans and Democrats batting over an economic stimulus.
The risk-off had investors racing into Treasuries, including the 10-year, for safety pushing yields lower.
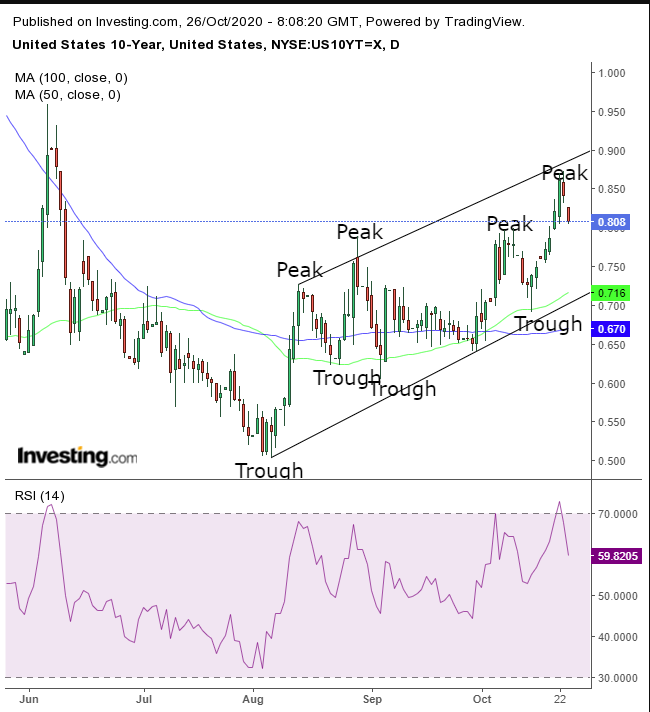
The fall in yields consists of a corrective move within an uptrend as framed by the rising channel, after the price reached its top and the RSI became the most overbought since early June.
If we see the forecast blue wave in the election results, where the Democrats win the White House, the Senate and Congress, the dollar is expected to weaken for two reasons:
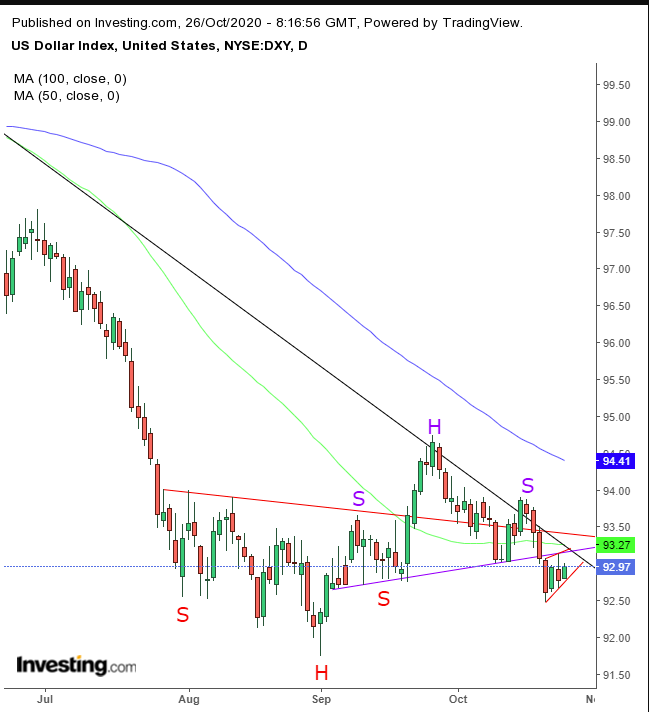
The dollar is on the rise, making it the fourth day of ups and downs, forming a potential rising channel, bearish after the four-day straight selloff that preceded it. It makes a lot of sense that there will be another setup for another leg down as the flag pole—the move before the flag’s formation—was itself the downside breakout that completed a H&S continuation pattern that upended the preceding failed H&S bottom. The picture favors a continuation of the underlying downtrend since the March peak.
Gold Waits for Elections Results?
Gold edged lower to $1,900, supported by the bottom of a rising channel and the 100 DMA.
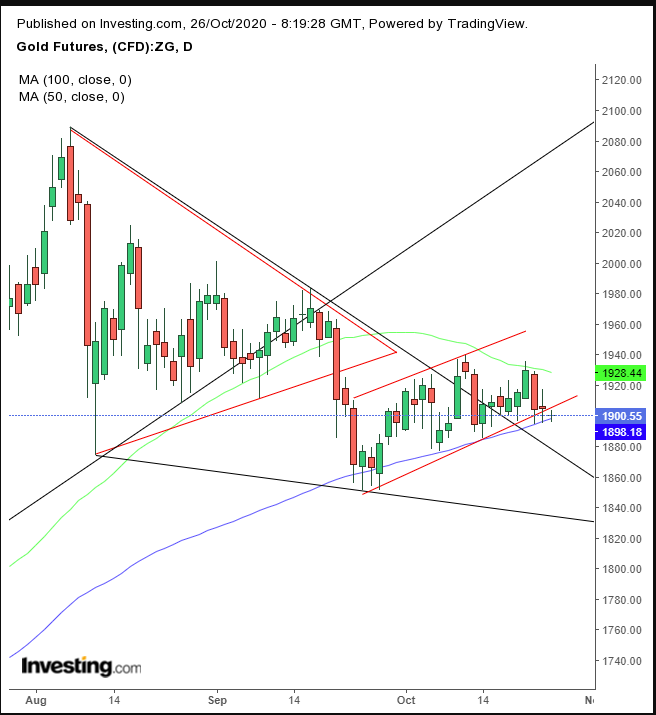
Gold has been eluding investors since Sept. 21, when it broke to the bottom side of a symmetrical triangle, instead of to its topside within the uptrend, falling below its uptrend line the March lows. Then, it completed another bearish pattern, a rising flag. However, enveloping both these bearish patterns is a large, falling wedge, bullish after the uptrend.
While the price climbed above the bullish wedge, it remains within the bearish flag—demonstrating how unsure investors are and that they may be waiting for a Trump win in the election to send gold higher or a Biden win to send it lower.
Notice how the price is squeezed between the 50 and 100 DMAs suggesting a break in one direction will create momentum for a larger move.
After Bitcoin more than hit our flag’s target and its RSI showed that momentum reached the most overbought condition since Aug. 1.
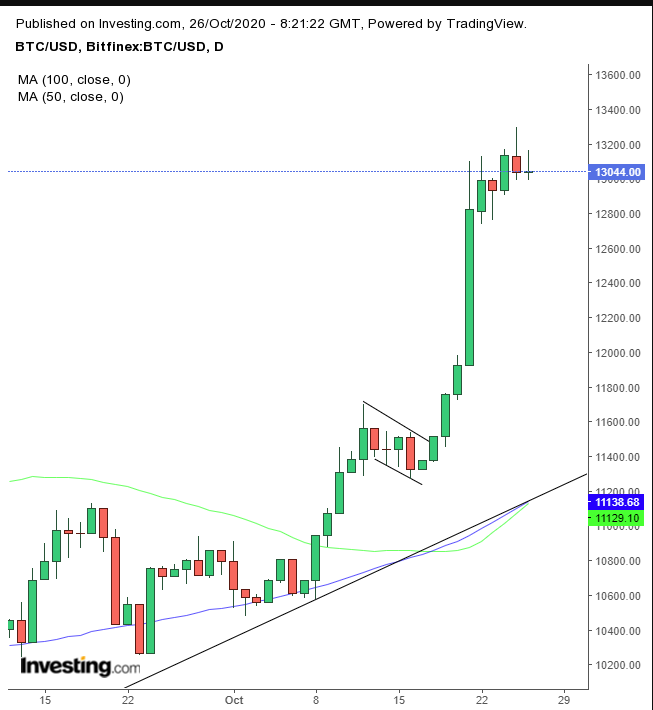
The cryptocurrency is primed for a corrective dip in a return to the uptrend line, before it returns higher.
Oil extended the selloff since falling below $39 per barrel for the first time since Oct. 2 on surging coronavirus cases and the stimulus impasse.
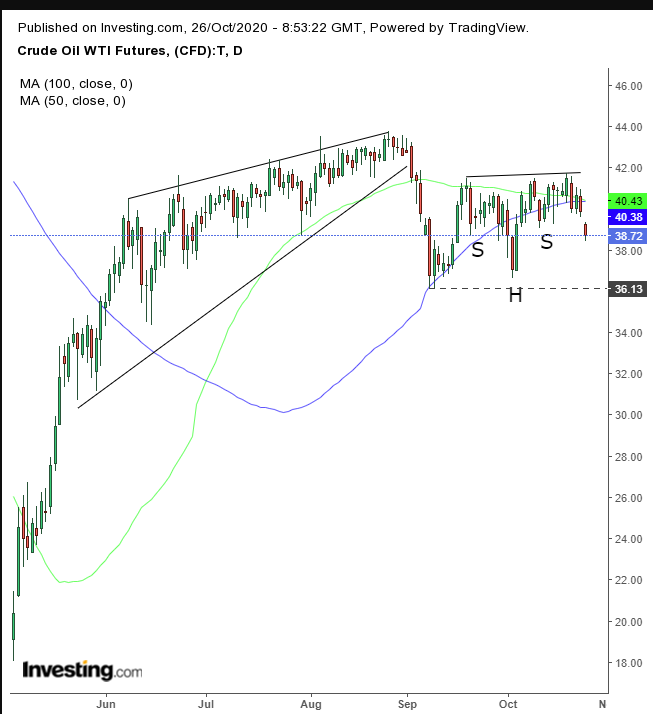
It appears that a potential H&S bottom is not in the works and the price is headed back toward $36, increasing the chances of a downside breakout to follow the bearish rising wedge May 22 to Sept. 1.
Market Moves
Stocks
Currencies
Bonds
Commodities
The Week Ahead
All times listed are EDT
Monday
10:00: US – New Home Sales: expected to rise slightly higher to 1,025K from 1,011K
Tuesday
8:30 US – Core Durable Goods Orders: to recede to 0.4% from 0.6%
10:00: US – CB Consumer Confidence: will probably rise to 102 from 101.8
20:30: Australia – CPI: expected to surge to 1.5% from -1.9%
Wednesday
10:00: Canada – BoC Interest Rate Decision: consensus keeps rates at 0.25%
10:30: US – Crude Oil Inventories
11:15: Canada – BoC Press Conference
Tentative: Japan – BoJ Monetary Policy Statement Outlook Report and Conference
Thursday
4:55: Germany – Unemployment Change: forecast to advance to -5K from -8K
8:30: US – GDP: predicted to leap to 30.9% from -31.4%
8:30: US – Initial Jobless Claims: seen to drop to 775K from 787K
8:45: Eurozone – ECB Interest Rate Decision: expected to remain unchanged
9:30: Eurozone – ECB Press Conference
10:00: US – Pending Home Sales: expected to halve to 3.5% from 8.8%
Friday
3:00: Germany – GDP: probably jumped to 7.3% from -9.7%
6:00: Eurozone – CPI: to remain at -0.3%
