S&P 500 (SPY)
There seems to be something different about yesterday's price action. I’m not sure, but one can’t feel good about a flat finish when the S&P 500 was trading around 3,337, only to finish at 3,322. It was a give back of about 40-45 bps. Not catastrophic, but some stock seems to have witnessed pretty sharp reversals throughout the day, which was interesting.
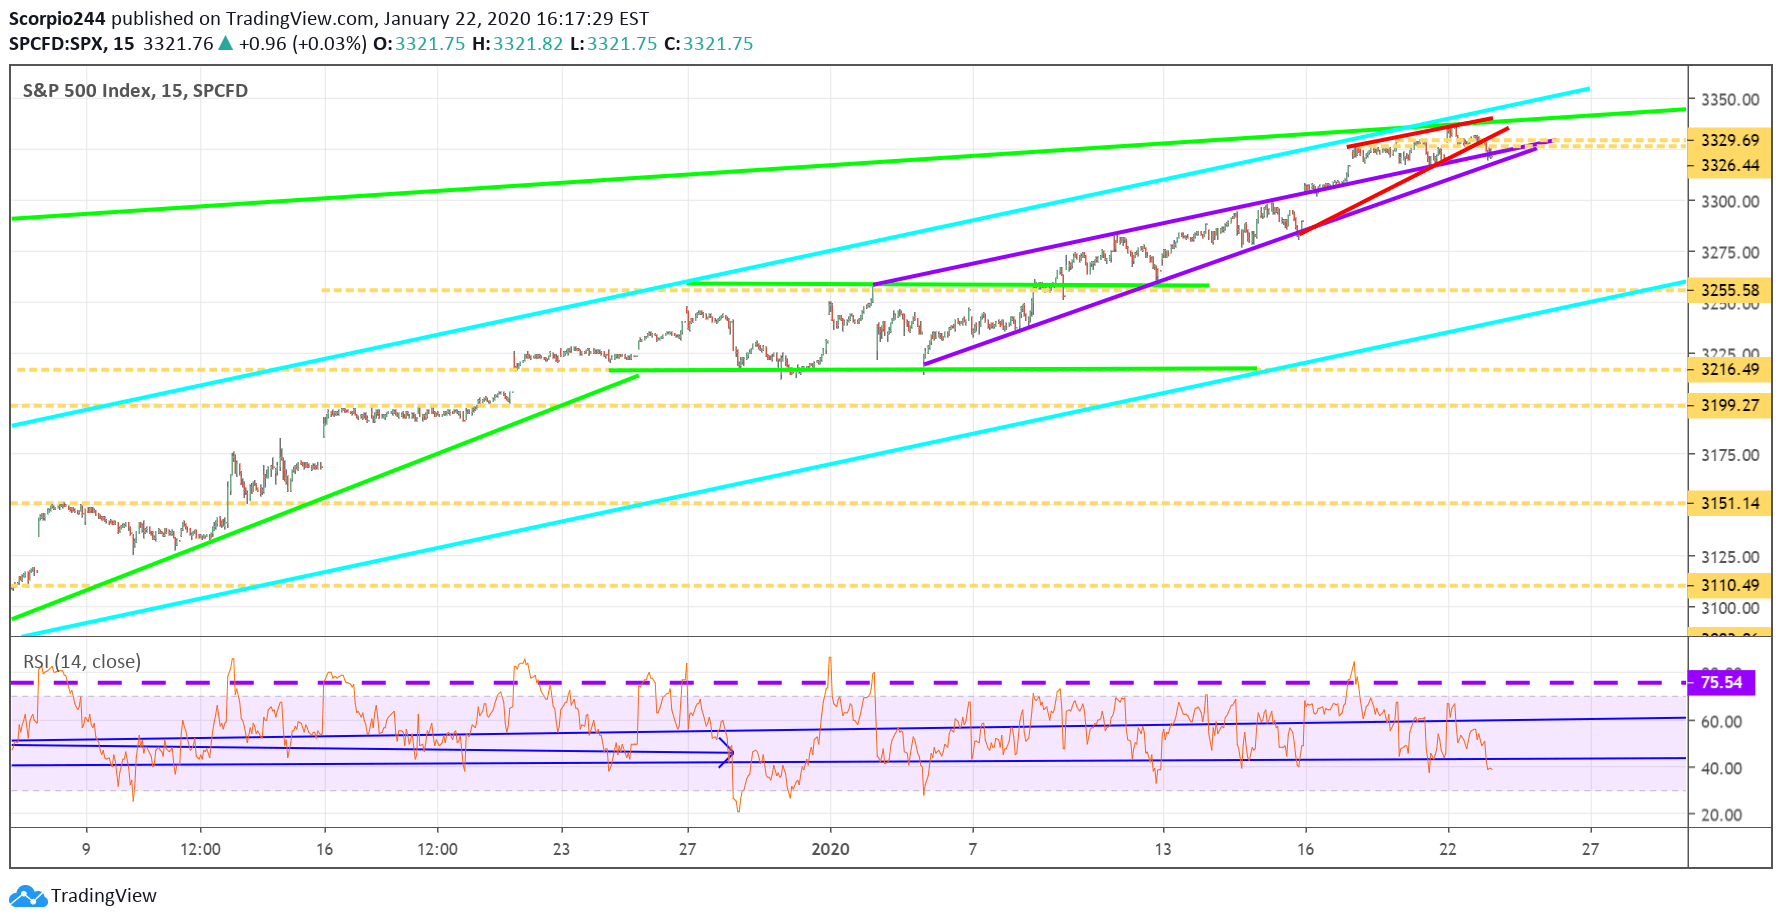
But more interesting is that the S&P 500 fell through the smaller rising wedge and is now very close to falling through the large rising wedge. So one will have to watch closely at this point because it could set up that decline to around 3,250, I have been harping on since the end of last week.
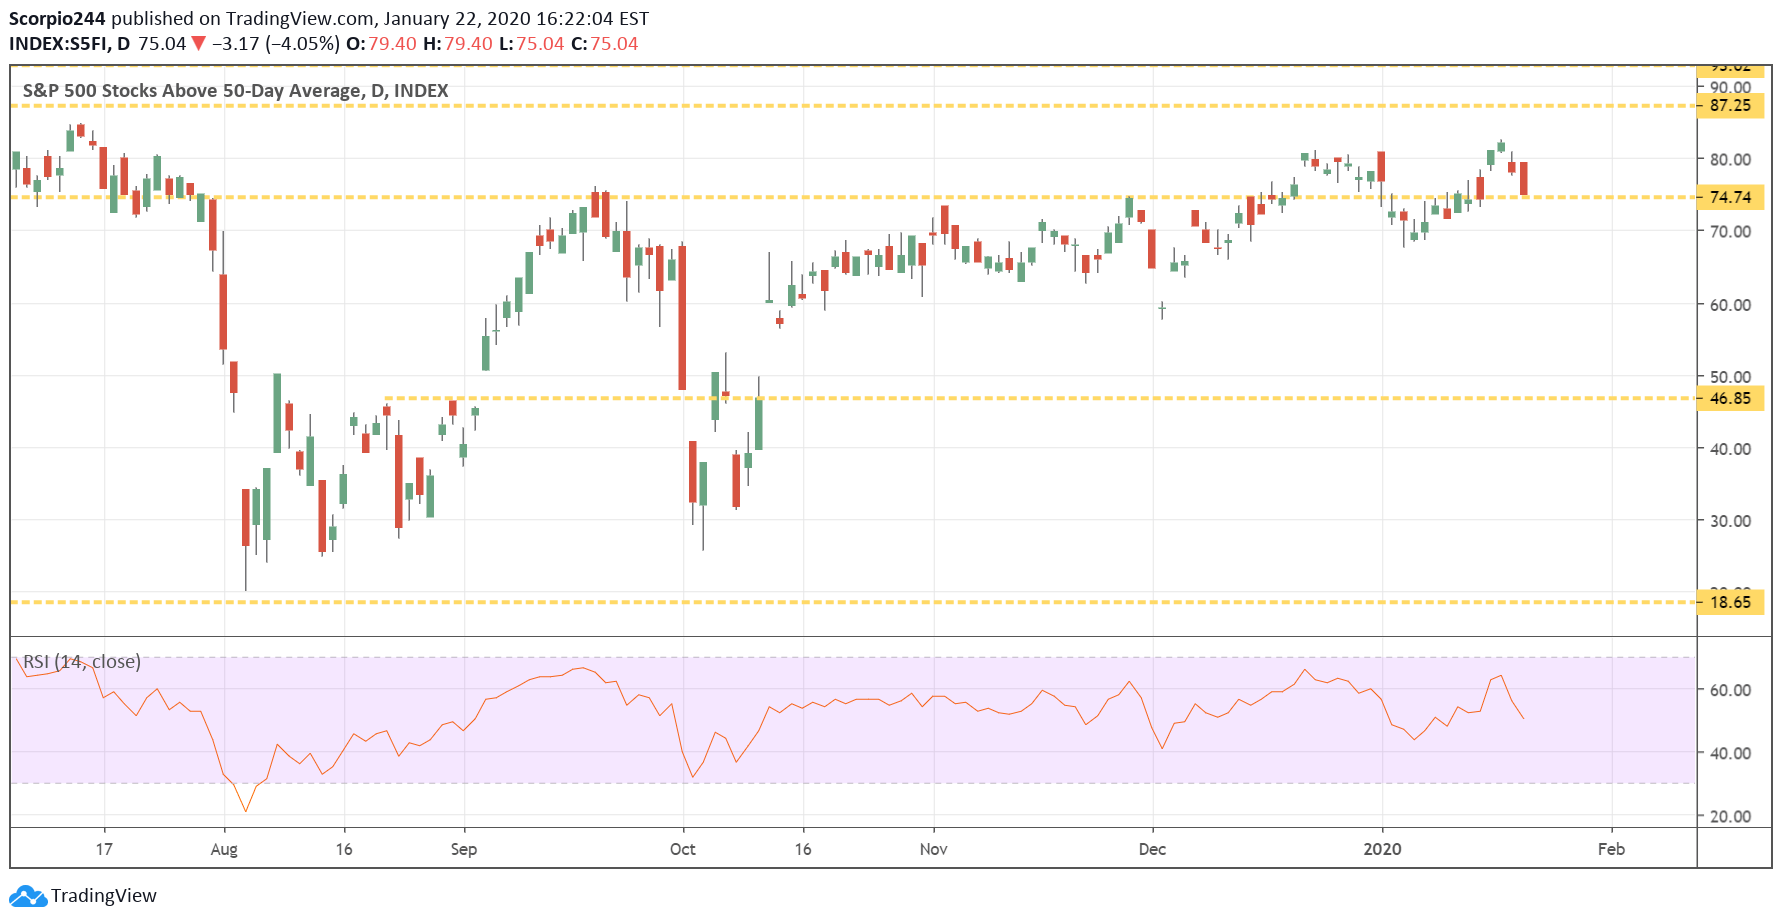
There are signs that some of the momentum may be coming out of the market with the number of stocks in the S&P 500 above their 50-day moving average falling to around 75%.
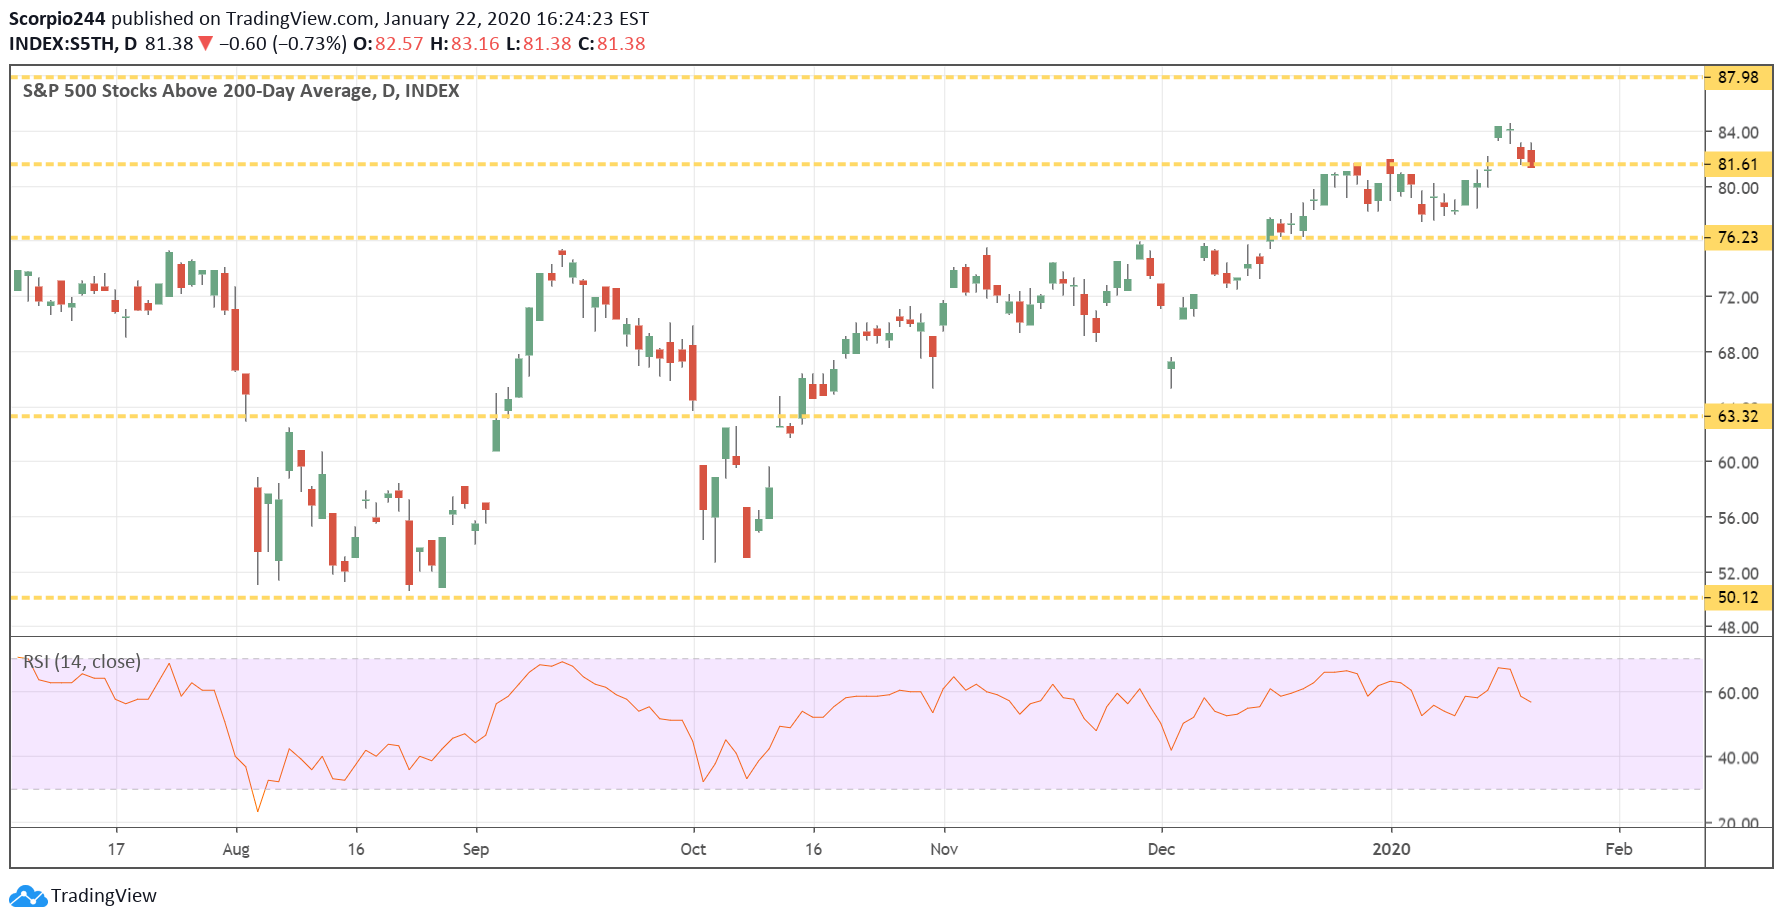
Also, the number of stocks above the 200-DMA is falling as well. Notice that both the 50 and 200 are sitting right on their levels of support. Interesting. Probably not a coincidence either.
Shopify (SHOP)
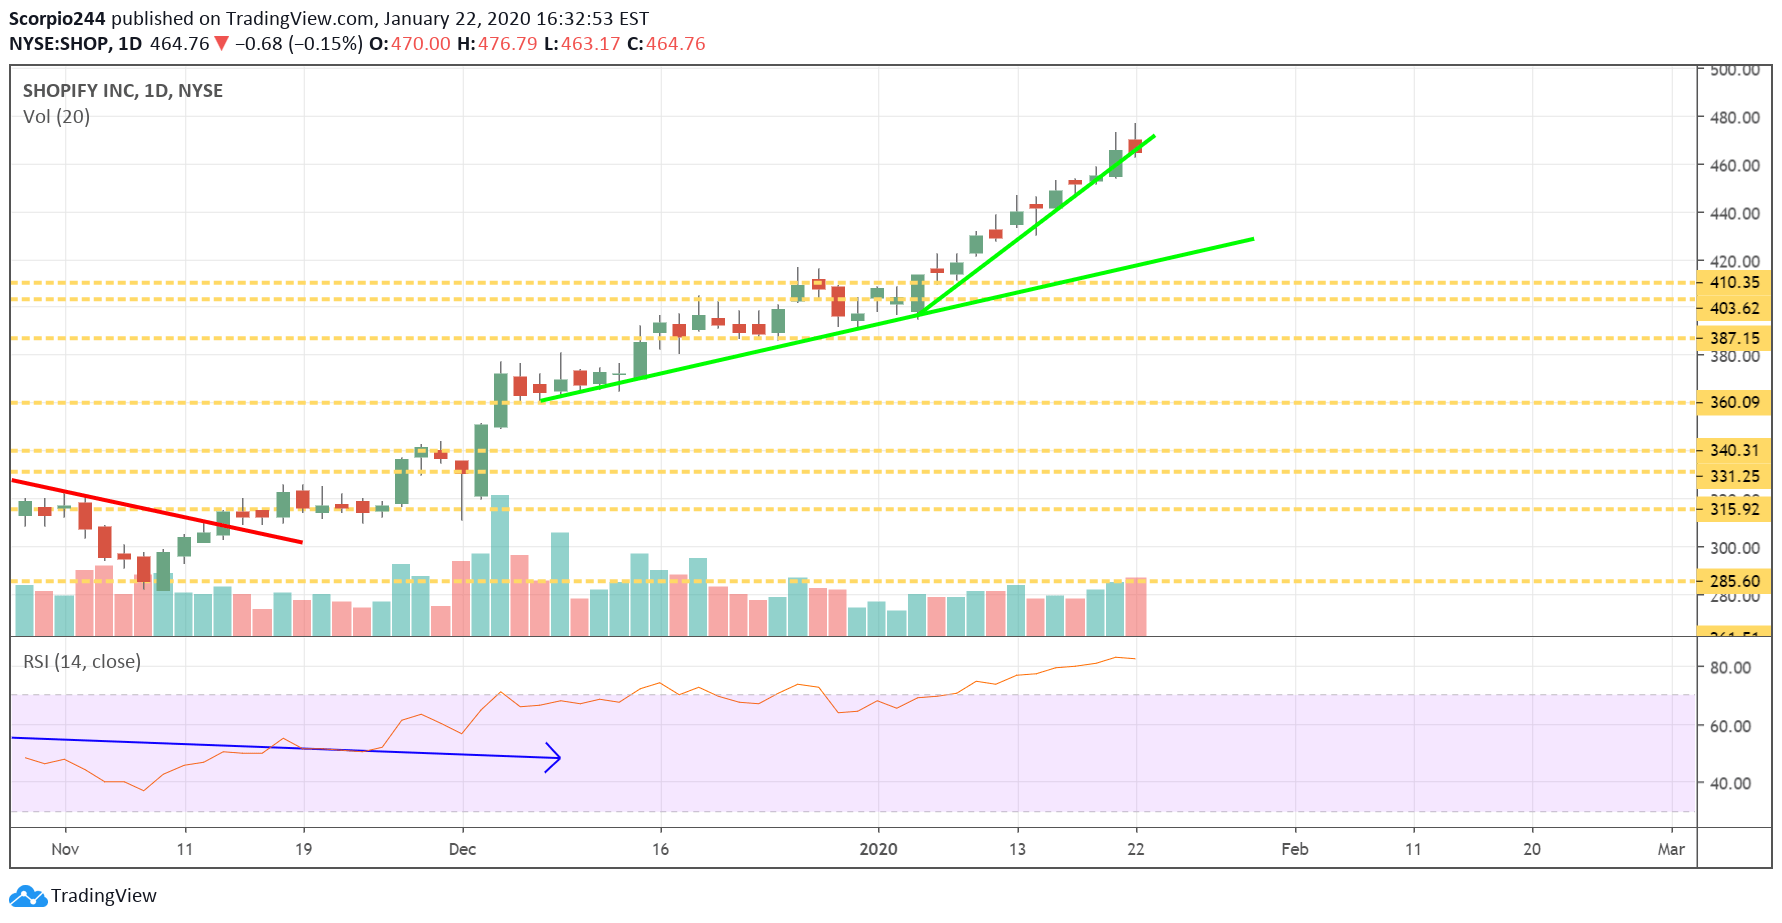
Meanwhile, not a good day for Shopify (NYSE:SHOP), with the stock giving back all of its gains to finish the day lower. Anyway, I continue to believe this one is heading to $420, no change in my view. It doesn’t help the matter that volume was up yesterday, probably because more sellers are stepping into the name.
Roku (ROKU)
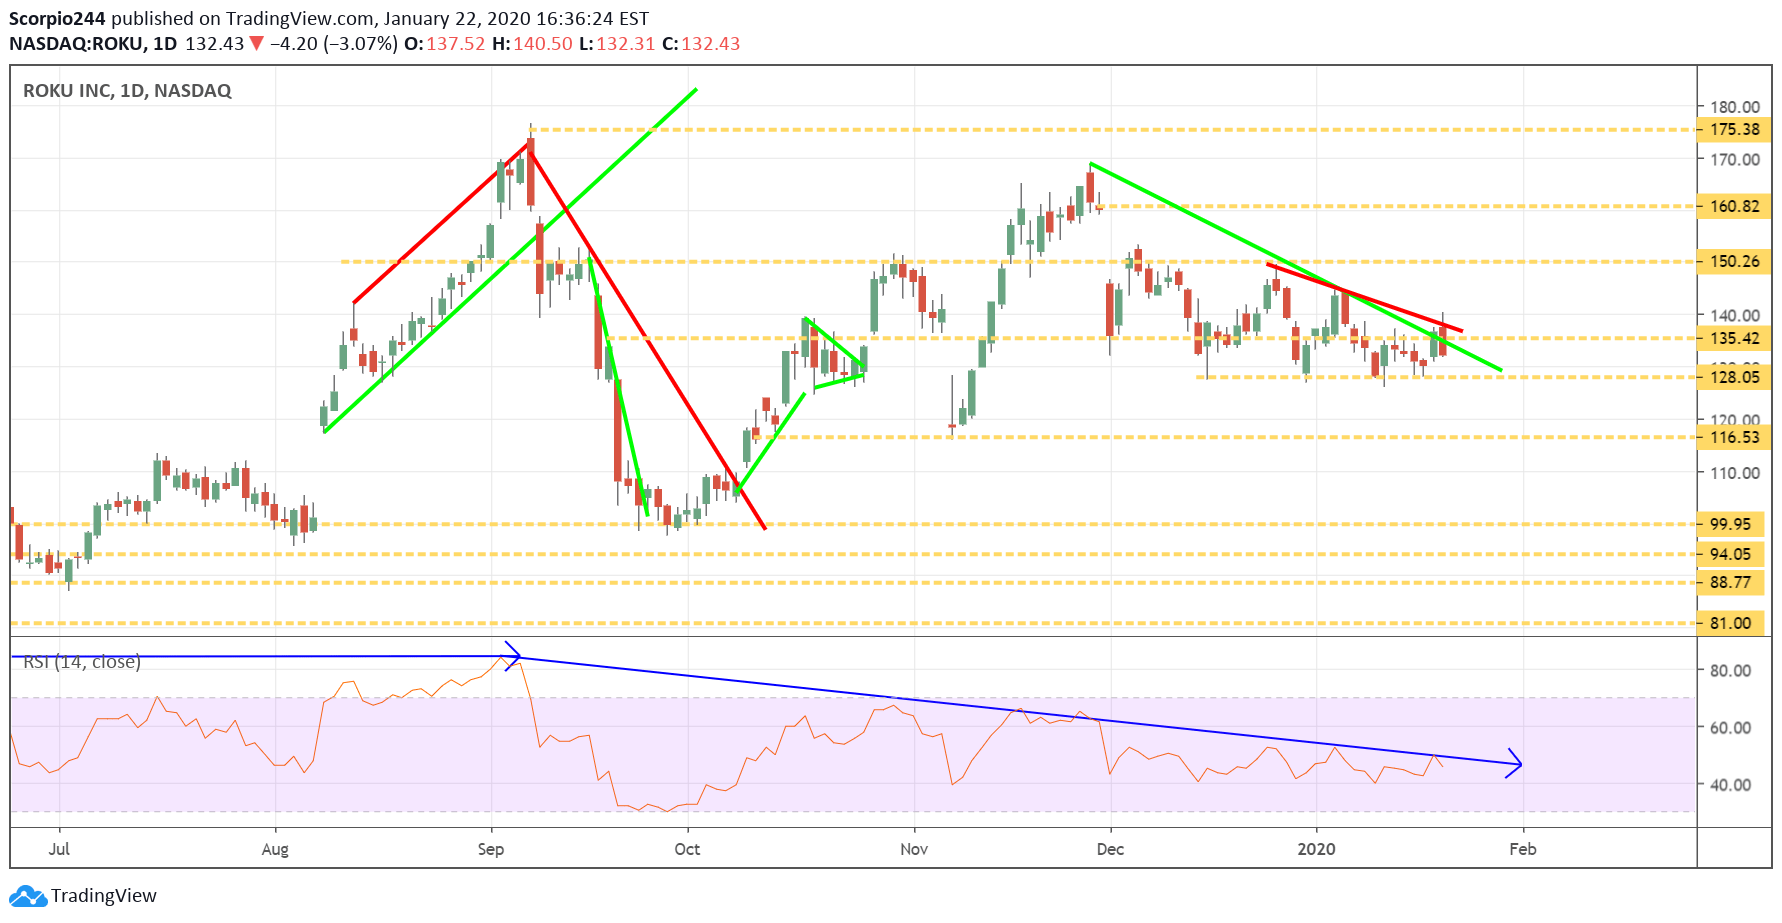
Roku didn’t have a great day either, with the stock failing at resistance, as I suspected it would.
Thinking about it, I’m beginning to think that $116 is likely the next stop. Just look at that RSI.
Beyond Meat (BYND)
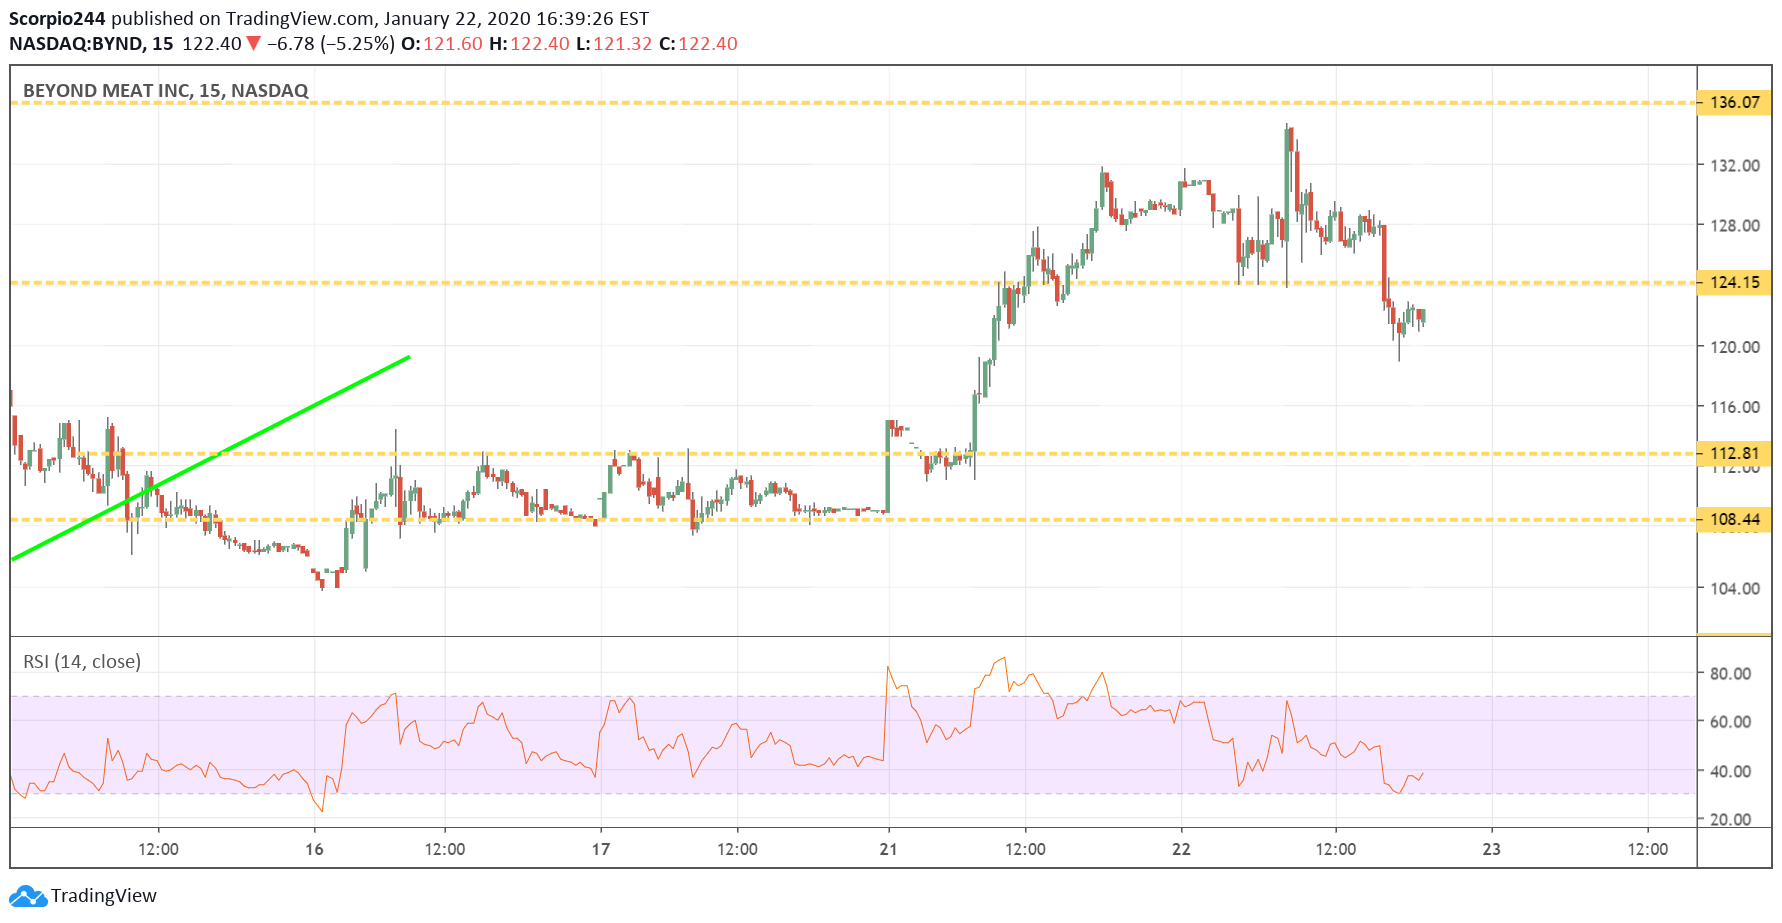
Beyond Meat (NASDAQ:BYND), not so good either. Burger King is slashing its price on the Impossible Whopper due to slowing sales! That doesn’t sound good for a growth stock. Maybe, it can fall back to $112.
Intel (INTC)
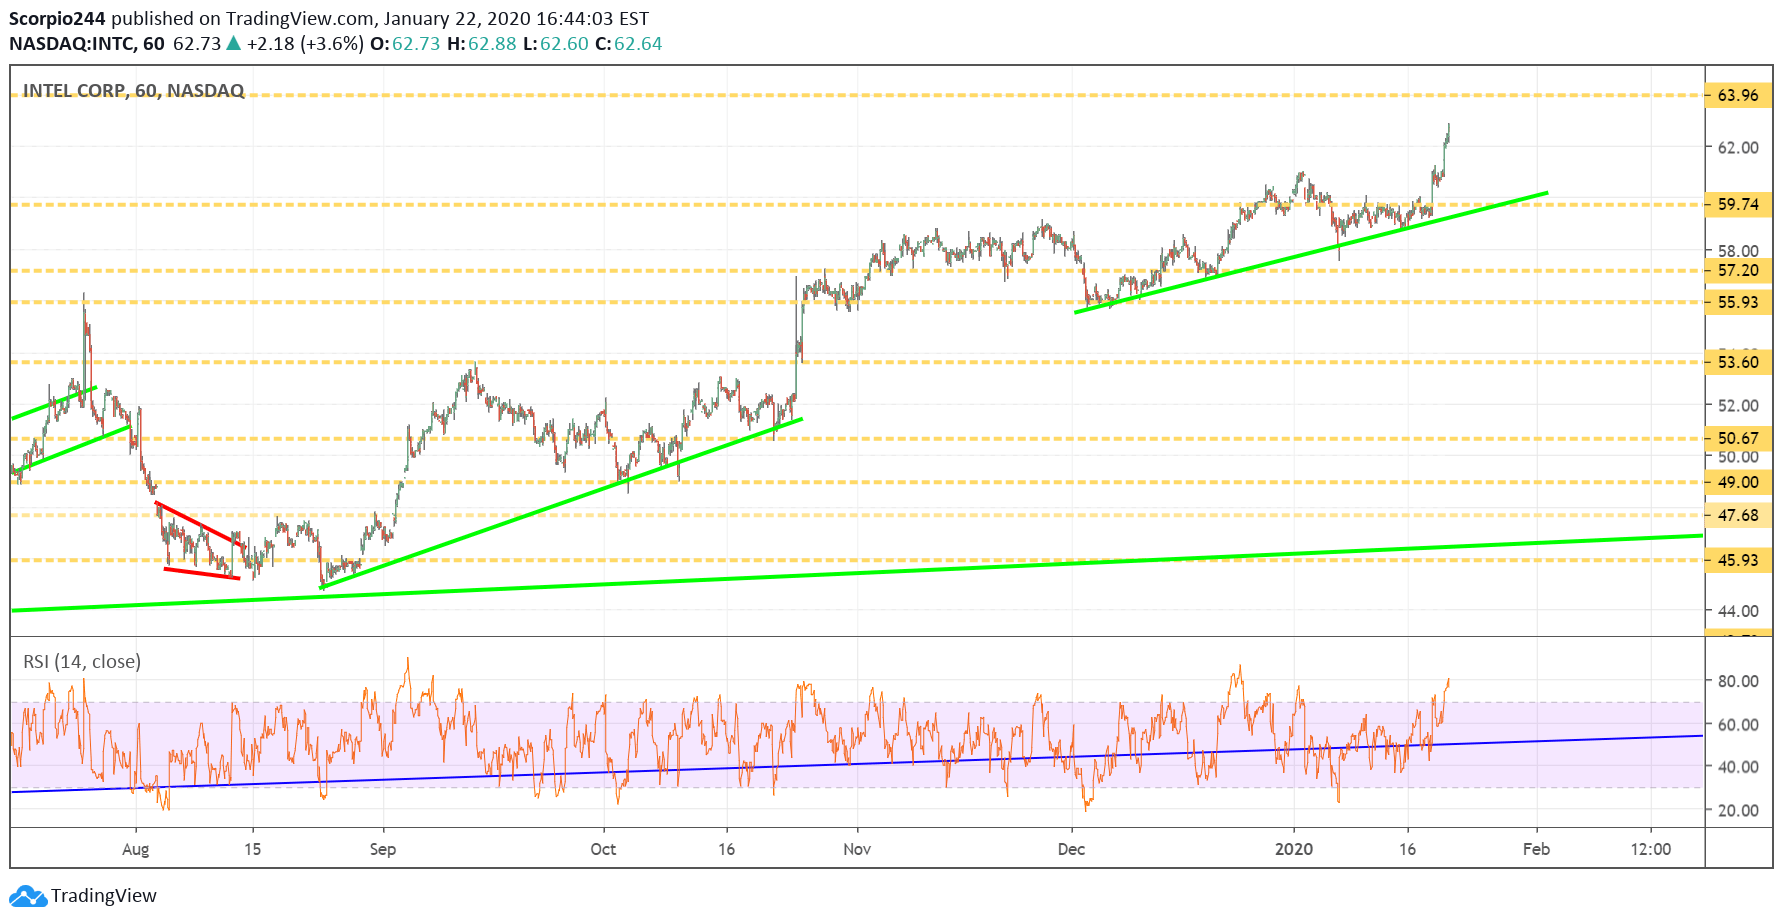
Those options guys must be happy, you know, with Intel (NASDAQ:INTC) up Wednesday. Those September calls we have been tracking were trading for $0.75 on January 10. Yesterday they were trading for $1.20. Not bad on 25,000 contracts.
Netflix (NFLX)
Netflix (NASDAQ:NFLX), not a great day, either. But you don’t want to know what I think; I’m wrong all the time anyway lately on this, that’s how it feels at least.
Boeing (BA)
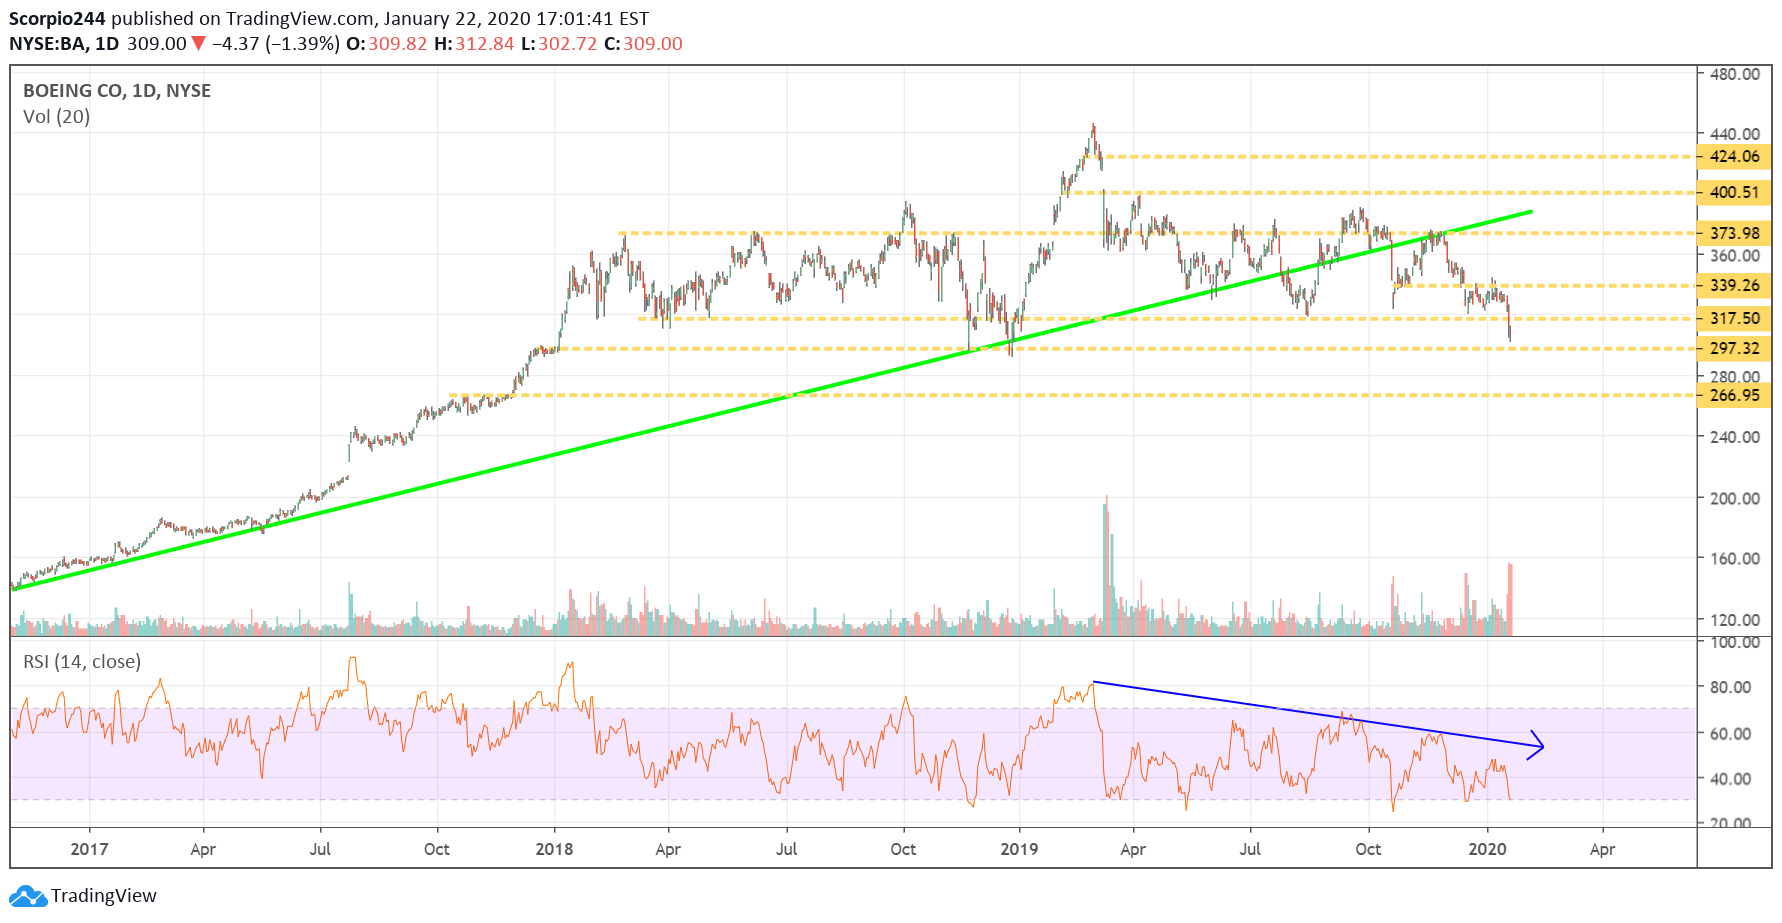
Finally, Boeing (NYSE:BA) is one scary chart. I noted in the mid-day update yesterday that I thought it could fall to around $265. It is sitting right on critical support above $297, the RSI looks like death, and the volume is rising as the stock falls. Not good. $297 is the defining line; it breaks that, it has a long way to fall.
