With the S&P 500 at all-time highs, stock market volatility remains notably absent. Many market strategists are calling for a correction. While a correction in stocks and spike in volatility will “eventually” happen (that I have no doubt), timing short term moves is extremely difficult.

Let’s determine the stock market’s most probable medium-term direction by objectively quantifying technical analysis. For reference, here’s the random probability of the U.S. stock market going up on any given day.

Transports are diverging from the S&P
A well-known bear (he has been bearish since 2016) is back at it again, proclaiming that “Dow Transports have diverged from the S&P. Bearish”
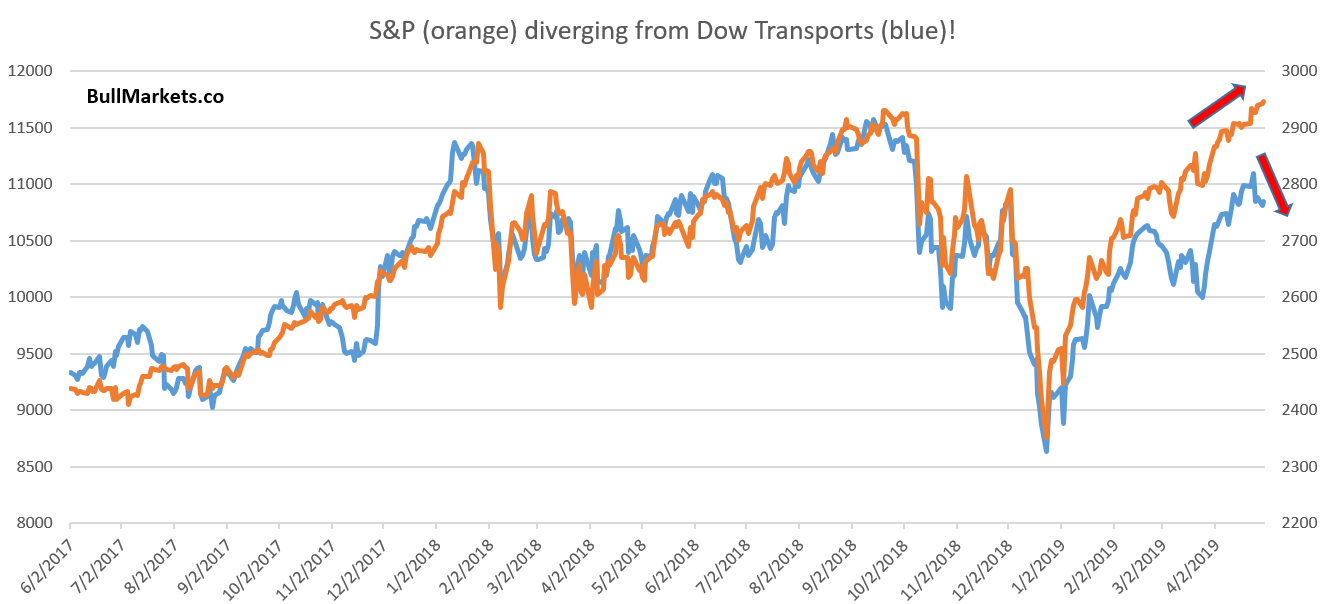
These charts are popular because they are designed as an optical illusion (just like those “it’s 1937 all over again!” fractals). Moreover, one can logically explain them as “transports matter as a sign of broad economic activity. Lagging transports must be bad news for the economy”.
As we’ve demonstrated many times in the past, most of these “divergences” and “logic” don’t make any sense.
Here’s what happens next to the S&P when it rallies more than 6% over the past 47 days, while Dow Transports rally less than 2.5%
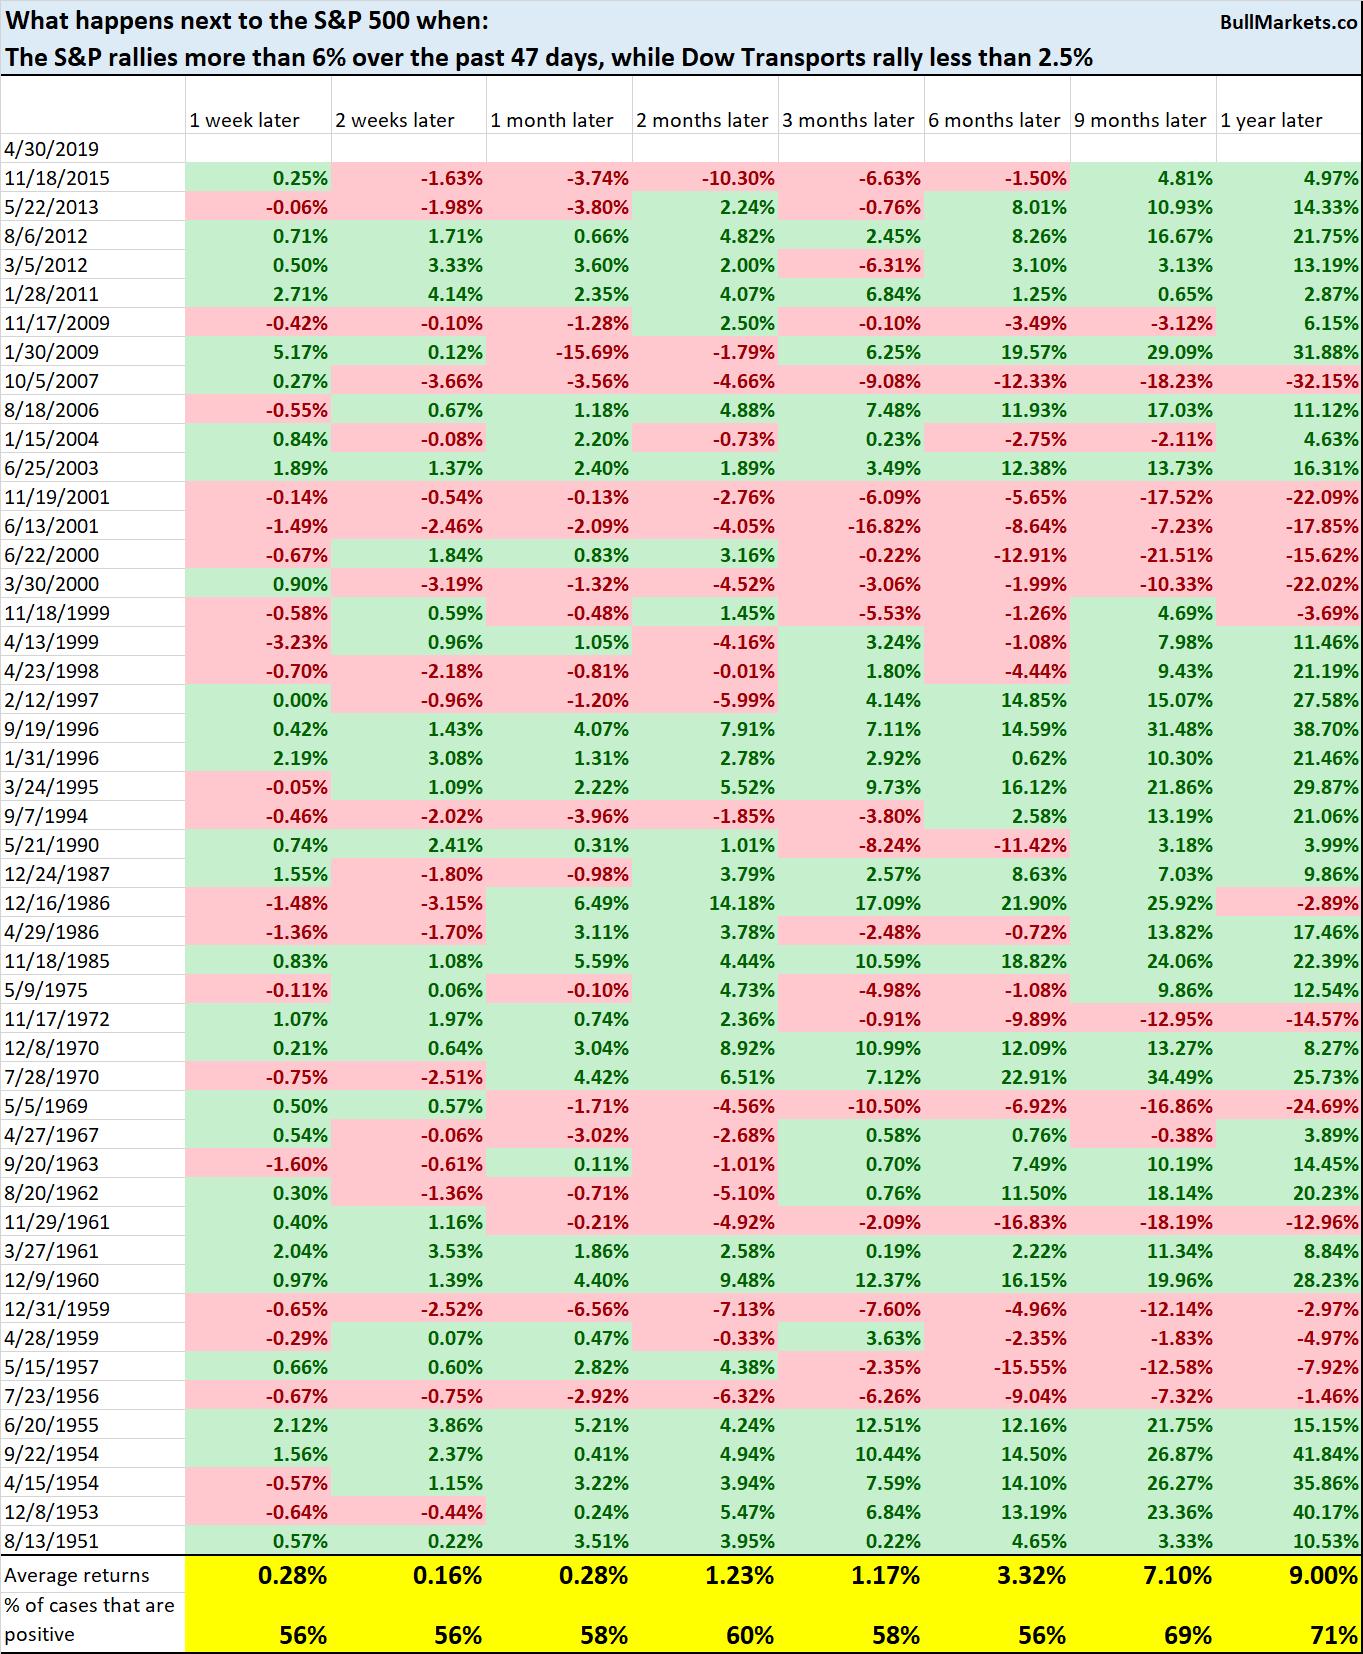
Happens quite often, and is neither bullish nor bearish. Just because an argument sounds “smart” doesn’t make it actually smart.
50 DMA
In a sign of low volatility, the S&P has gone 71 consecutive days without falling below its 50-day moving average. This rally has been relentless.

Here’s what happens next to the S&P when it goes 71 consecutive days without falling below its 50 DMA.
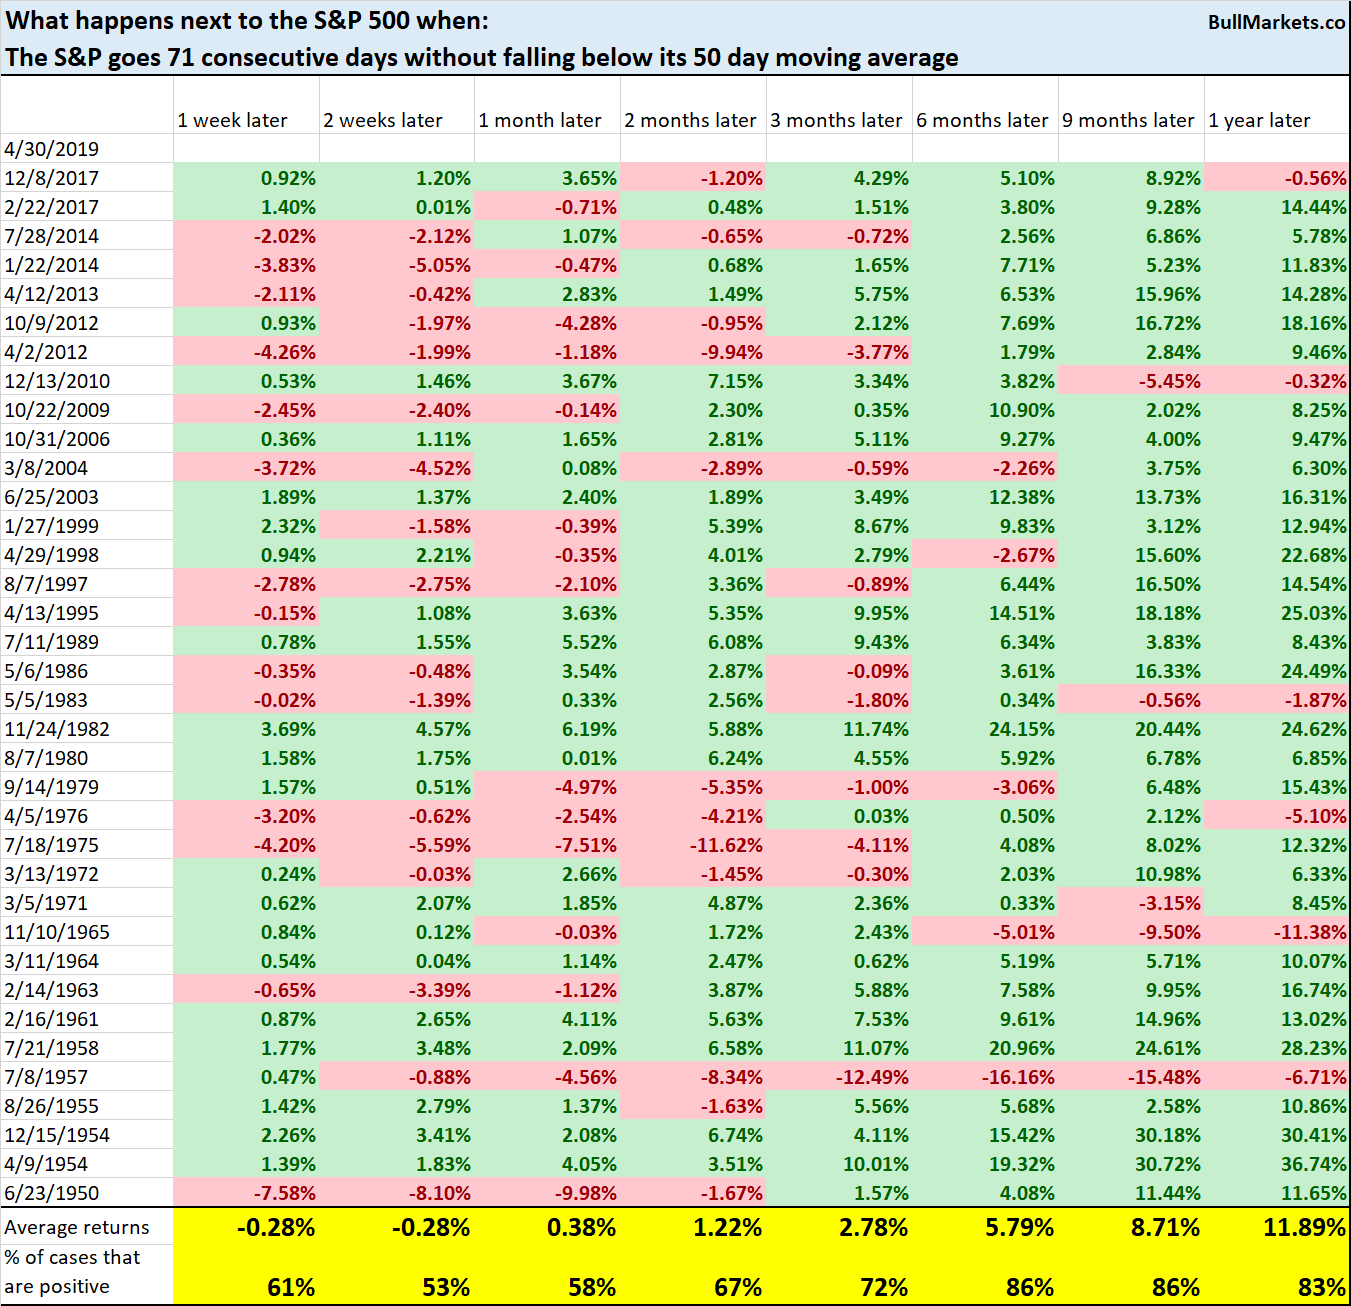
Short term is random, but 6-12 month forward returns are mostly bullish.
VIX 10-day correlation
VIX and the S&P are both trending higher right now.
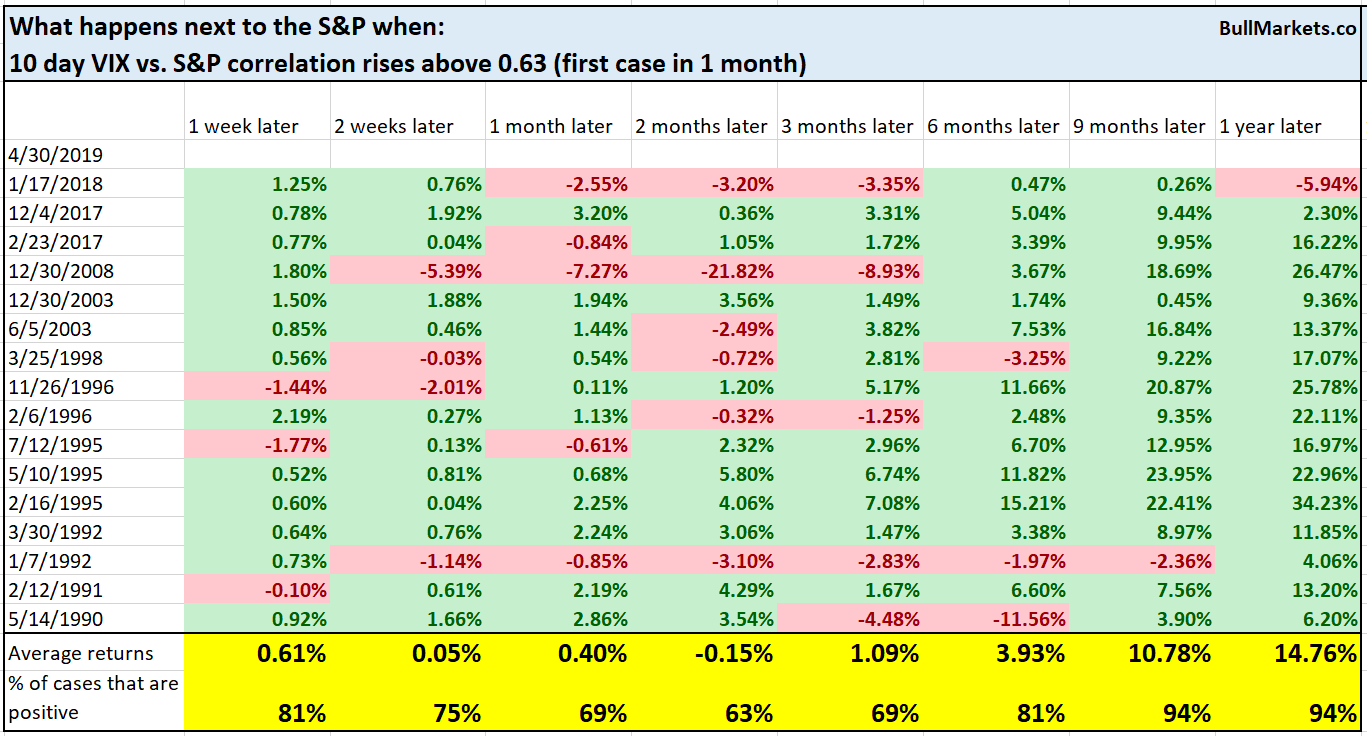
Yesterday we looked at VIX’s 20-day correlation with the S&P. To better understand VIX and the S&P’s recent correlation, we can look at their 10-day correlation, which is currently at +0.63

As you can see, the “last time this happened was January 2018”, when volatility soared and the stock market tanked.
But to avoid recency bias, we must look at the data holistically.
From 1990 – present, here’s every case in which the 10-day VIX versus S&P correlation was above 0.63.
Here’s what happens next to VIX.
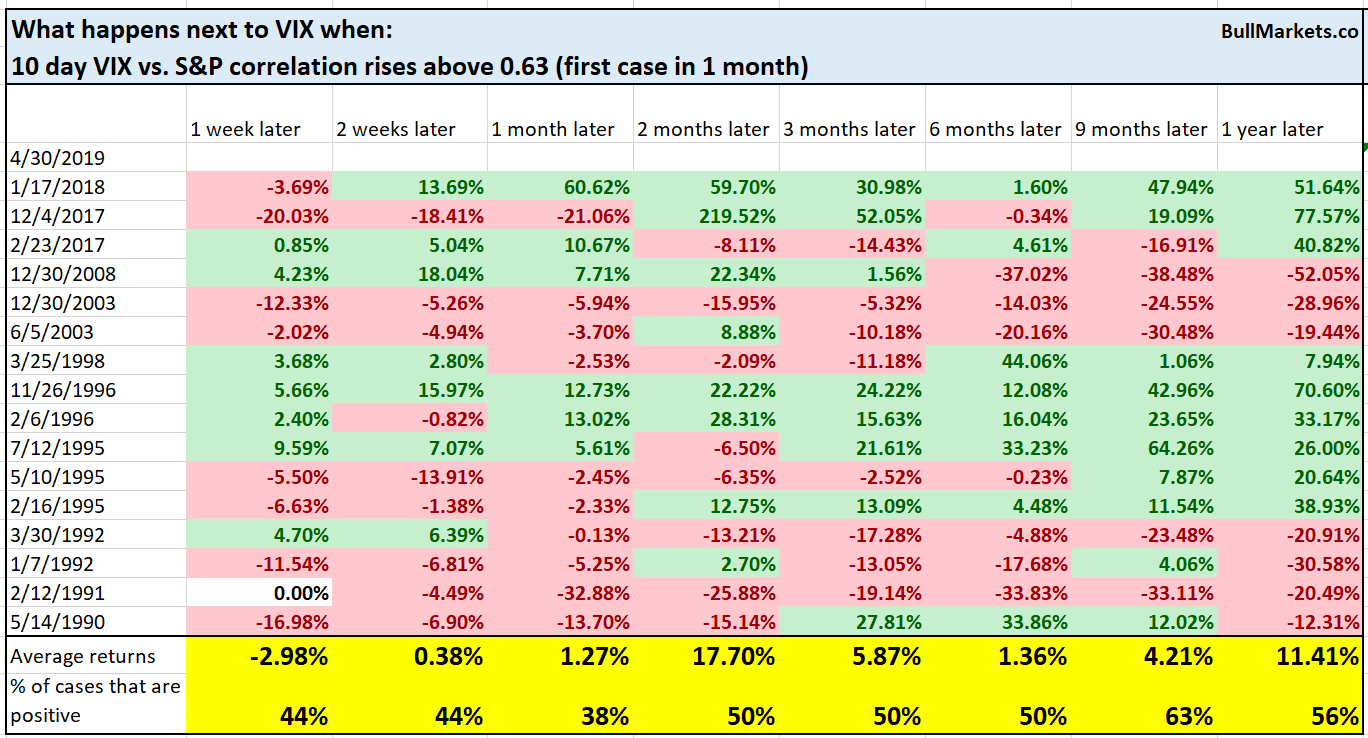
Once again, you can see how the short term is extremely hard to time. Yes, “eventually” the stock market will correct and VIX will spike. But you don’t know if that will happen tomorrow, in a month, in 3 months…
VIX down 4 months
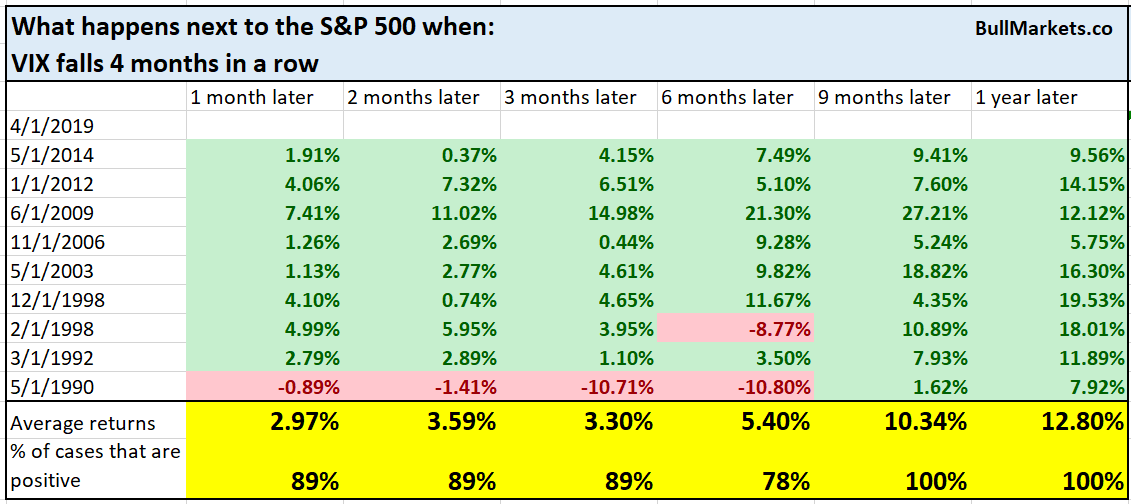
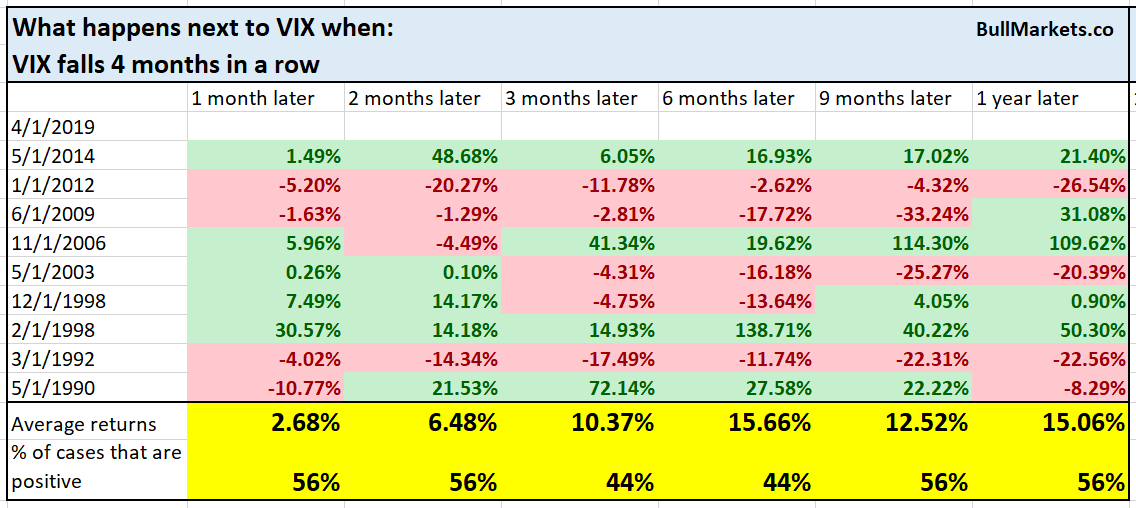
VIX is down 4 months in a row.

Historically, such long losing streaks in VIX were mostly bullish for the S&P and random for VIX.
*4/1/2019 is not April 1, 2019. It’s as of April’s close. This is merely the data’s DATE format.
SPY volume during earnings season
The stock market’s volume is quite low right now, which is uncommon considering we just went through earnings season.

SPY’s volume during the last 2 weeks was more than -50% below its 1-year average.
Here’s what happens next to the S&P when SPY’s volume is this low.
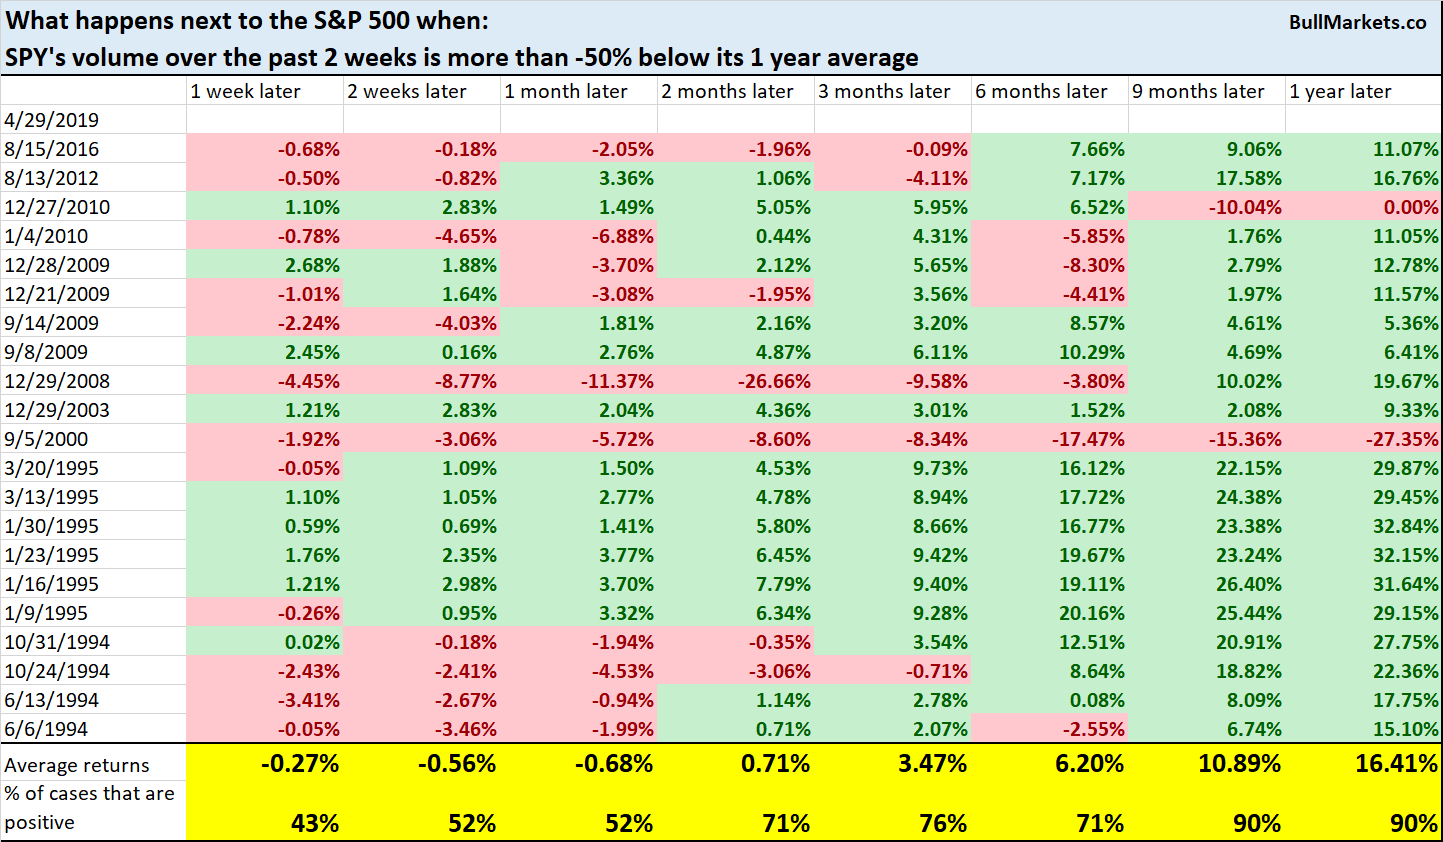
What if we only look at the historical cases that occurred during earnings season month? (January, April, July, October).
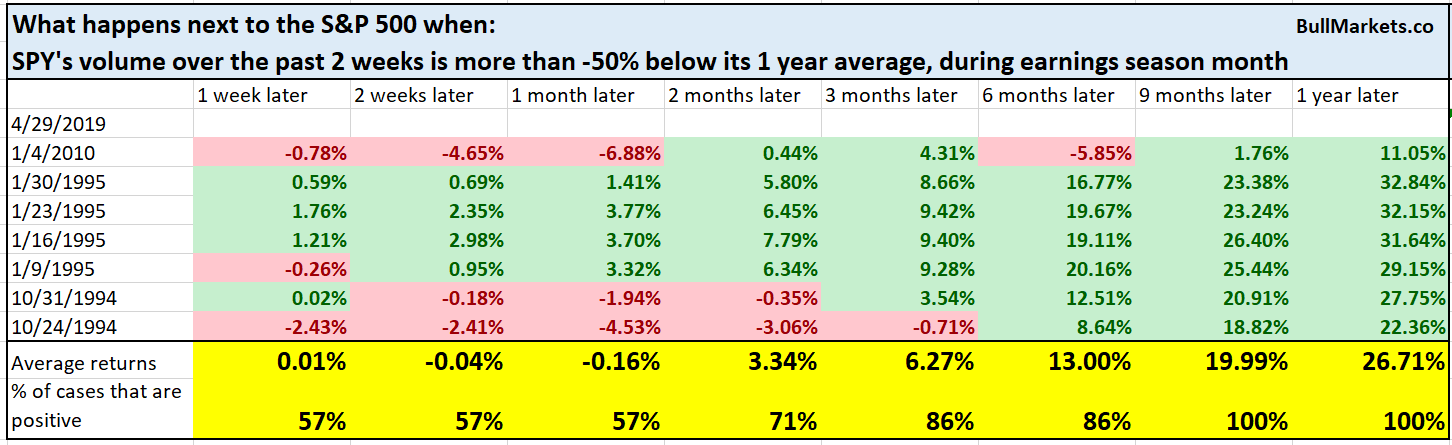
It’s interesting to note that the S&P’s breakout in 1995 was on “low volume”. Clearly, low volume breakouts are not all that bearish, as the technical analysis books would suggest.

Copper: gold vs 10-year yield
One of our members looked at the copper: gold ratio vs. the 10 year Treasury yield recently. He posed the question “what does this imply for the 10-year yield”?

Let’s look at the data. Here’s what happens next to the 10 year Treasury yield when the copper: gold ratio rises by at least 0.002, while the 10-year yield falls more than -0.2% over the past 86 days.
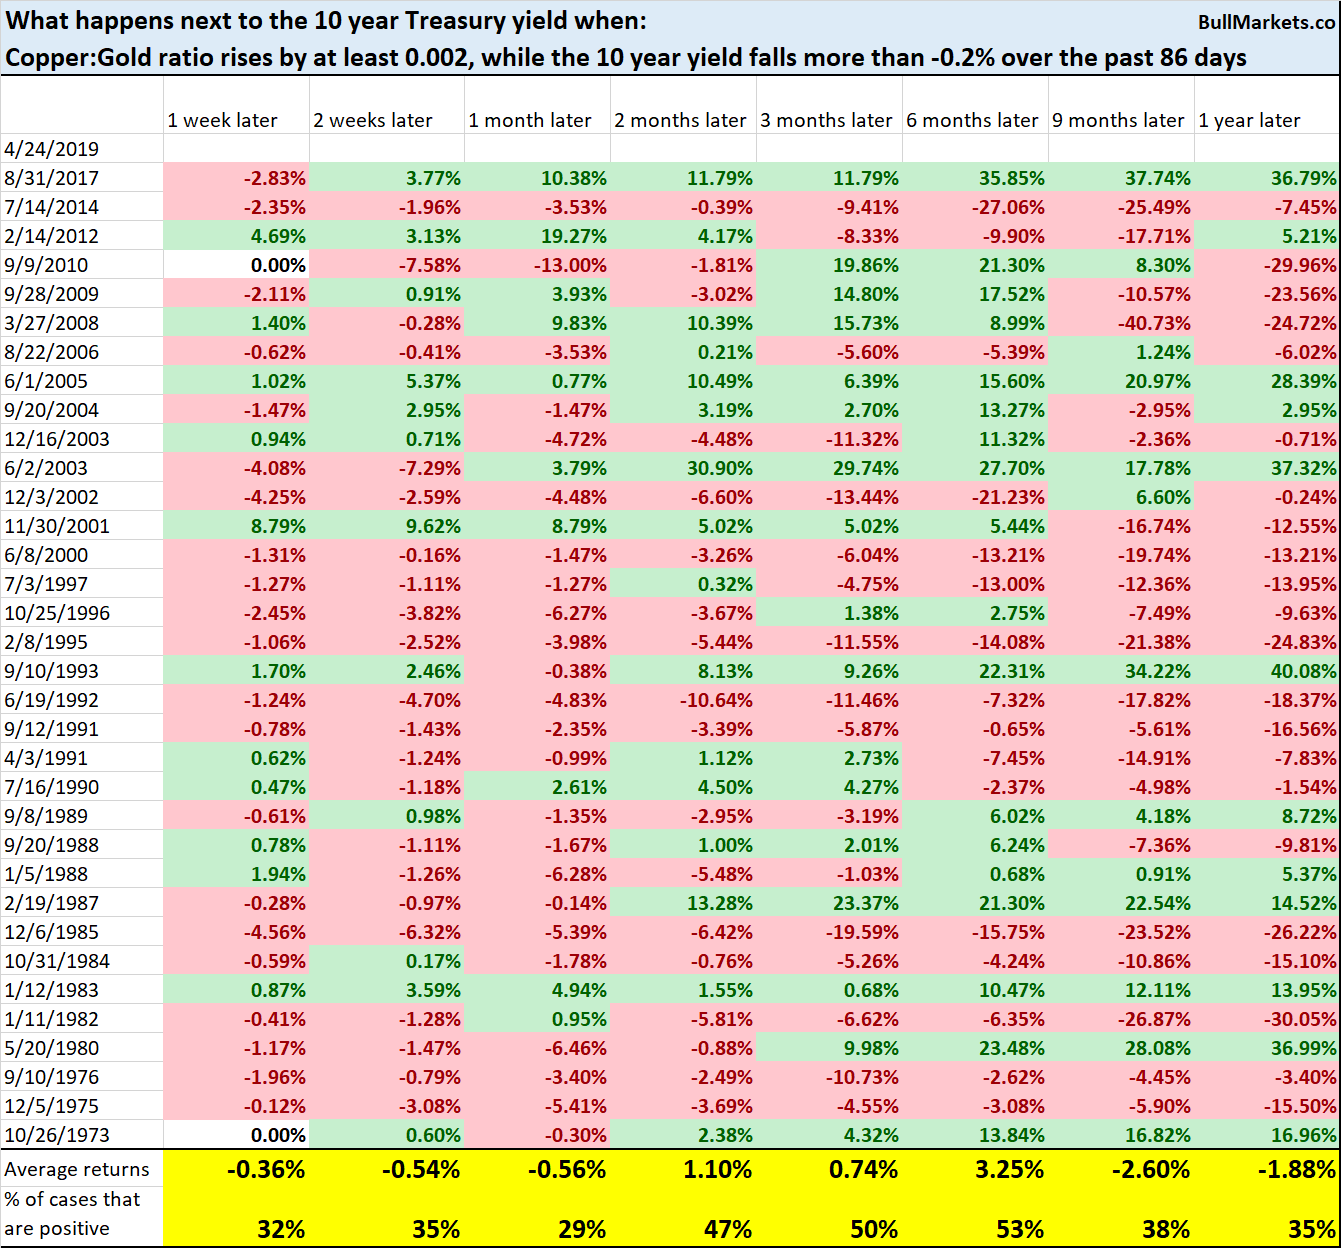
You can see that this is mostly bearish for the 10-year yield 1 month later. However, it’s also worth keeping in mind that most of this historical data occurred during a 40-year bond bull market (40-year interest rate bear market).
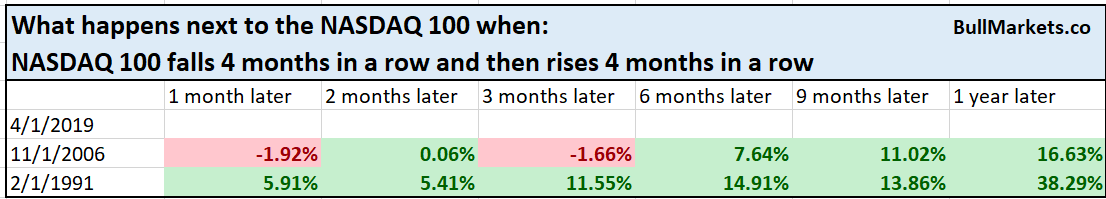
NASDAQ 100
The Nasdaq 100 has gone up 4 months in a row after falling 4 months in a row. Over the past 25 years, this has only happened 1 other time: November 2006.

While this sort of hype-y content (“the last time XYZ happened was [insert crash date]”) is good for financial marketers who want to trigger your recency bias and loss aversion, it doesn’t mean much.
That’s like using n=1 to make decisions.
Anyways, this is indeed exceptionally rare. From 1985 – present, this has only happened 2 other times.
One more thing…
I’ve noticed an interesting trend over the years. The more a hedge fund manager, professional trader, or investor goes on financial TV and other marketing channels, the worse his performance gets.
- A big example is Ray Dalio. Ray Dalio really started to make a lot of public appearances since 2012, when the book Hedge Fund Market Wizards was published. And since then, his performance has been mostly lackluster.
- A small hedge fund that I follow has been mostly bearish since 2016 (i.e. mostly wrong). They didn’t spend much time before 2017 trying to get into financial media, getting popular on social media, etc. They lost -20% in 2017, and decided to spend more effort on getting popular. After a big +40% gain in 2018, they are once again down -20% in 2019 (so overall down -14%). Now they are spending more time than ever on trying to get popular by appearing on interviews, podcasts, Bloomberg articles, social media, etc.
So why is it that the more a hedge fund manager or investor tries to get in the media, the worse his performance gets? I don’t know the answer, but I can guess a few reasons:
- It all comes down to “what are you trying to optimize for”. Are you trying to optimize for performance, or are you trying to optimize for popularity? Time is finite, and the more time you spend on optimizing for popularity, the less time you have to spend on actual trading.
- Going public about a position makes you less likely to be flexible and change your opinion as the data changes. This is because admitting “I was wrong” in public is like slapping yourself across the face. But as we all know, flexibility and the ability to admit “I was wrong” is the key to become a good trader/investor. I have seen famed bearish economists dig in their heels so much that they’ve stooped down to the level of “the Dow fell -400 points today. It fell -400 points in 2008. It’s 2008 all over again”. (You’d think that said famed economist would know what nominal #’s are…)
- Managers, investors, and traders that spend a lot of time trying to get in the media and become popular are usually the ones with poor performance. Hence they need that marketing boost from the media. Otherwise, performance should mostly speak for itself. (So is it that going on the media makes an investor perform more poorly, or is it that the media attracts investors that perform poorly but know how to say smart things? The chicken vs. egg conundrum).
Anyways, just some thoughts. This pretty much sums up why I don’t waste my energy trying to decipher the talking heads on TV. Focus on the data, focus on the facts, and ignore opinions.
Conclusion
Here is our discretionary market outlook:
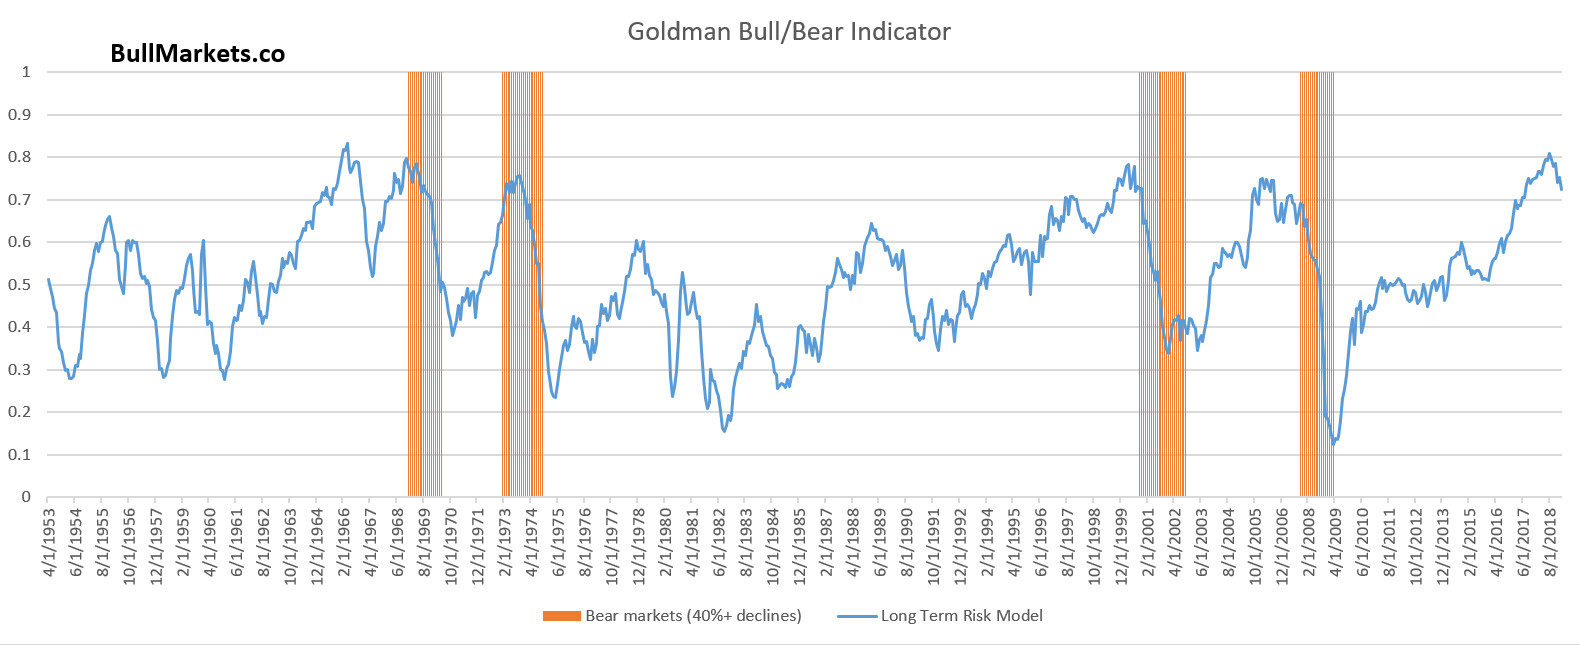
- The U.S. stock market’s long term risk: reward is no longer bullish. In a most optimistic scenario, the bull market probably has 1 year left. Long term risk: reward is more important than trying to predict exact tops and bottoms.
- The medium-term direction (e.g. next 6-9 months) is mostly mixed, although there is a bullish lean.
- We don’t predict the short term because the short term is always extremely random, no matter how much conviction you think you have. Focus on the medium-long term.
Goldman Sachs’ Bull/Bear Indicator demonstrates that risk: reward does favor long term bears.