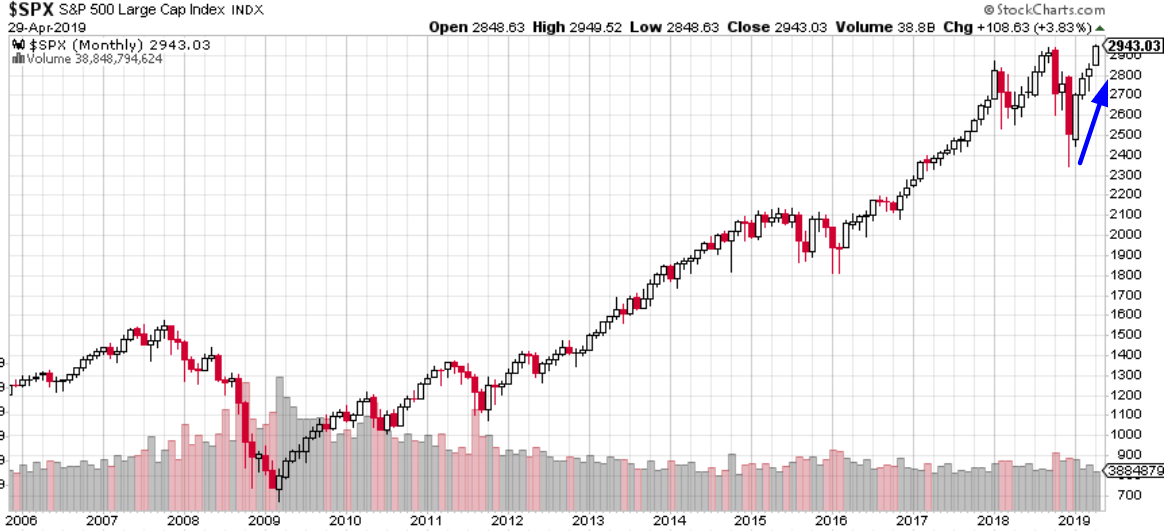
The S&P 500 has officially made a new all-time high on an intraday HIGH basis. Meanwhile, many traders and pundits have claimed that the stock market rally “doesn’t make any sense”, because so many factors are “diverging from it”.

Go here to understand our fundamentals-driven long term outlook.
Let’s determine the stock market’s most probable medium term direction by objectively quantifying technical analysis. For reference, here’s the random probability of the U.S. stock market going up on any given day.

VIX vs. the S&P
VIX and the S&P have both been trending higher over the past 1.5 weeks.

As a result, VIX and the S&P’s 20 day correlation has now risen above -0.5 for the first time since September 2018!

Is this bearish? Does a rising VIX imply that the S&P will soon fall?
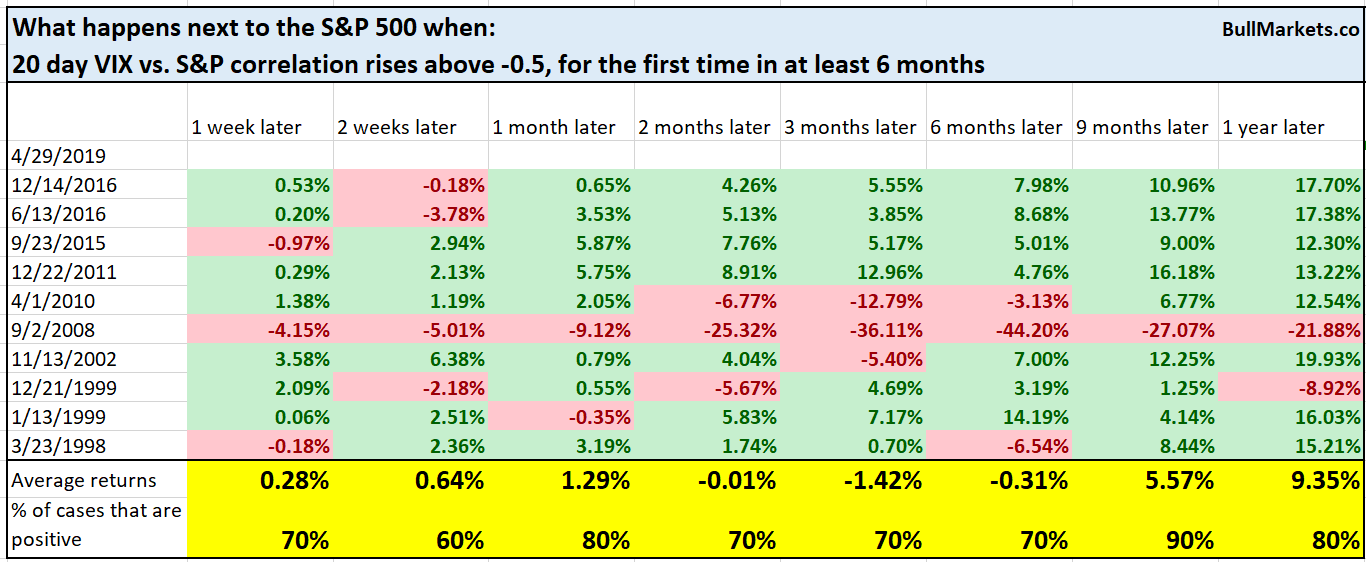
Here’s what happens next to the S&P when its 20 day correlation with VIX rises above -0.5 for the first time in at least half a year.
*Data from 1990 – present
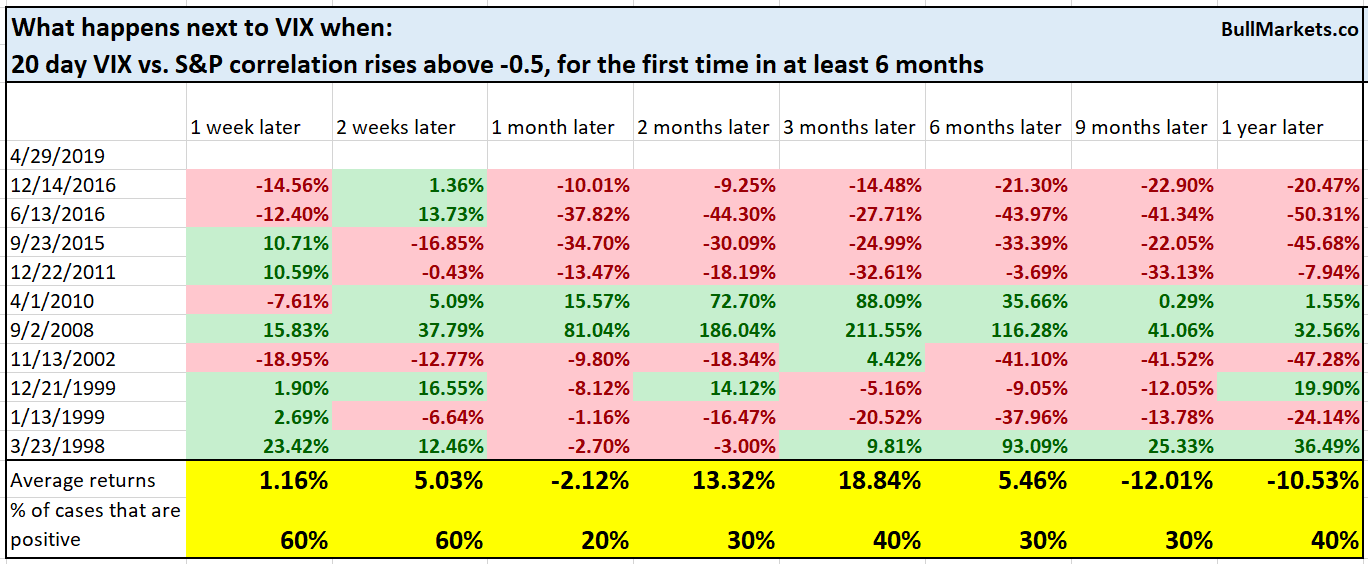
Here’s what happens next to VIX
Not consistently bearish for the S&P
Popular opinion
I recently came across a tweet from a Bloomberg reporter
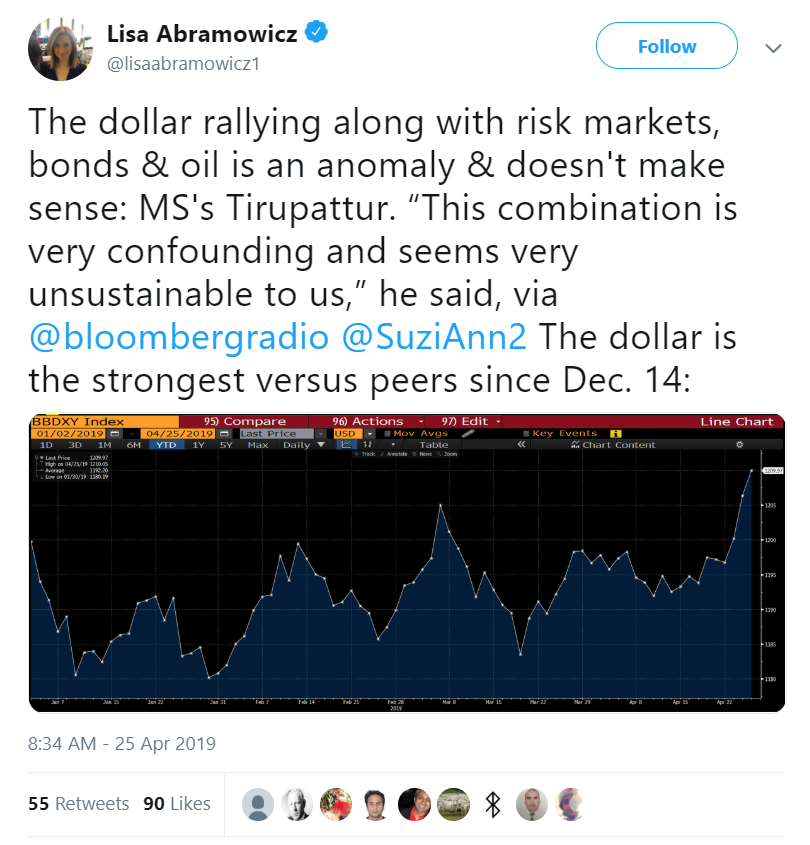
The popularity of this tweet pretty much sums up the sentiment among a lot of market watchers: “the markets don’t make sense anymore”.
Let’s backtest this thesis to see if it holds ground.
Is it abnormal for the S&P to rally along with the USD?

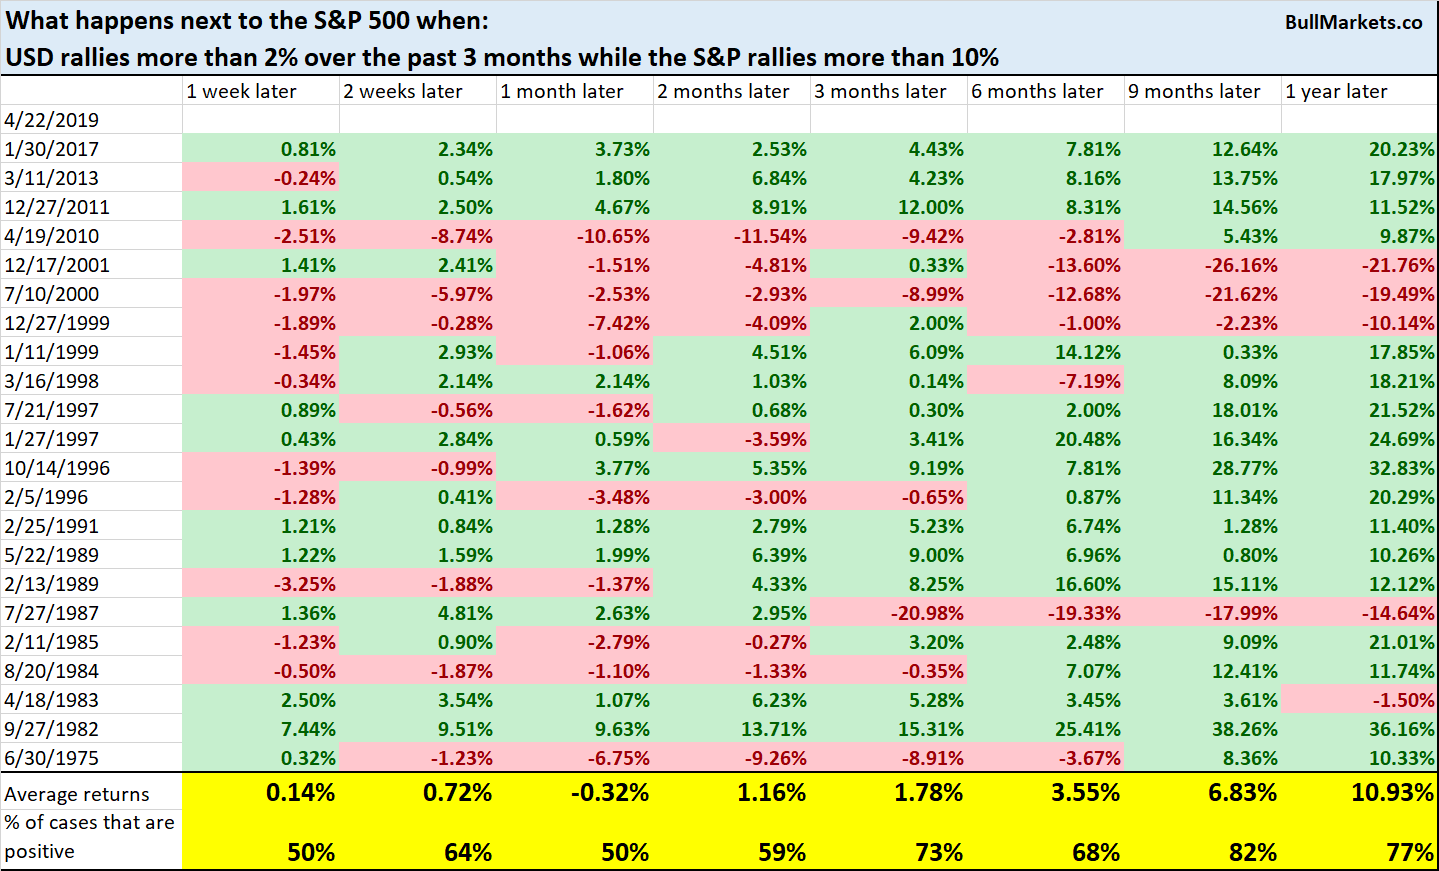
Here’s what happens next to the S&P when it rallies more than 10% over the past 3 months while the U.S. dollar rallies more than 2%.
Here’s what happens next to the USD Index.
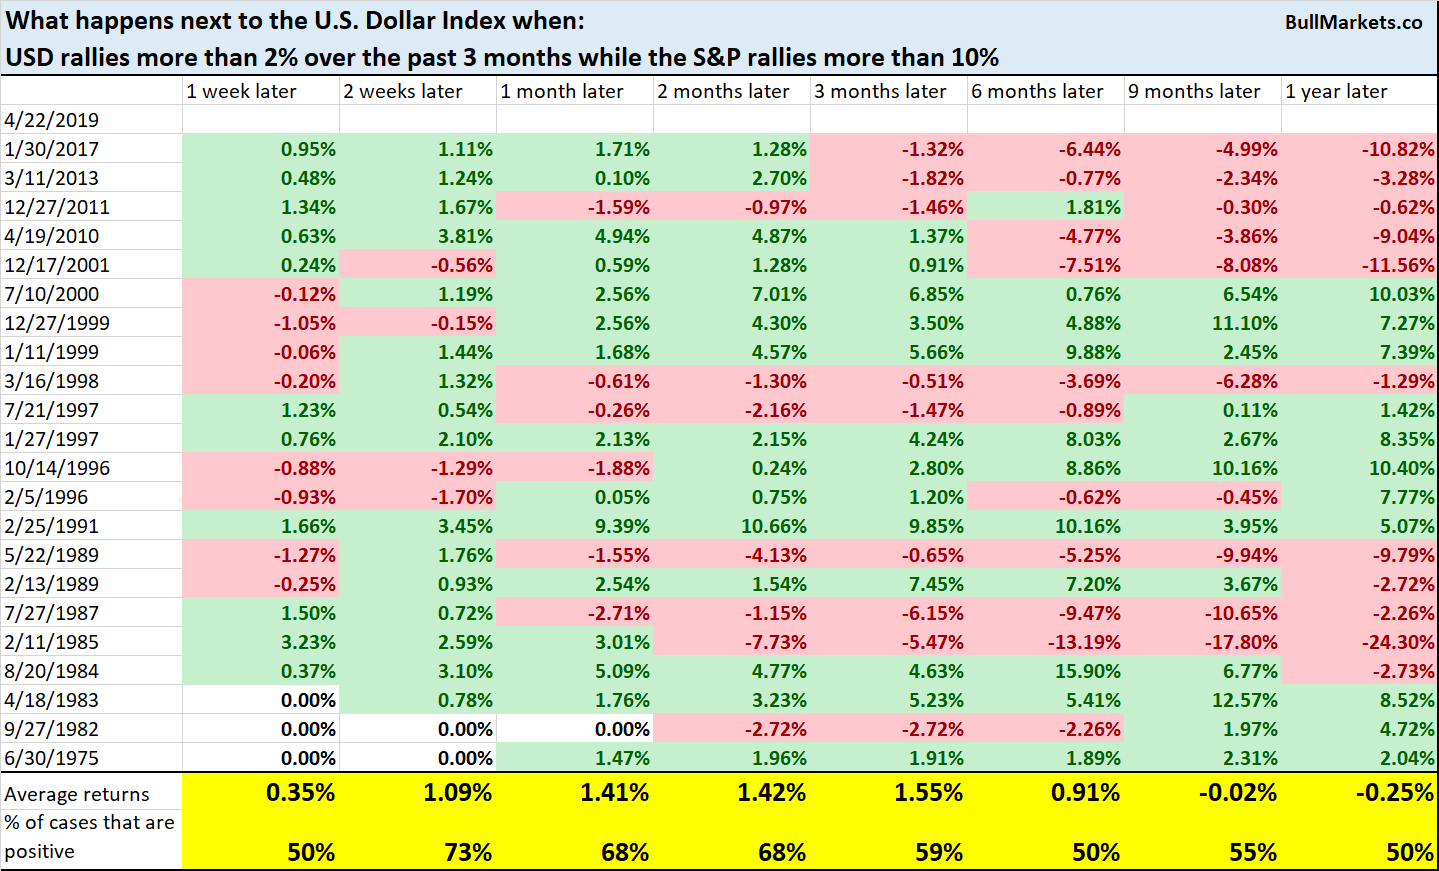
Not “unprecedented” or consistently bearish for the stock market.
What about the oil rally that’s coinciding with a USD rally? Surely commodities can’t rally when the dollar is rallying?

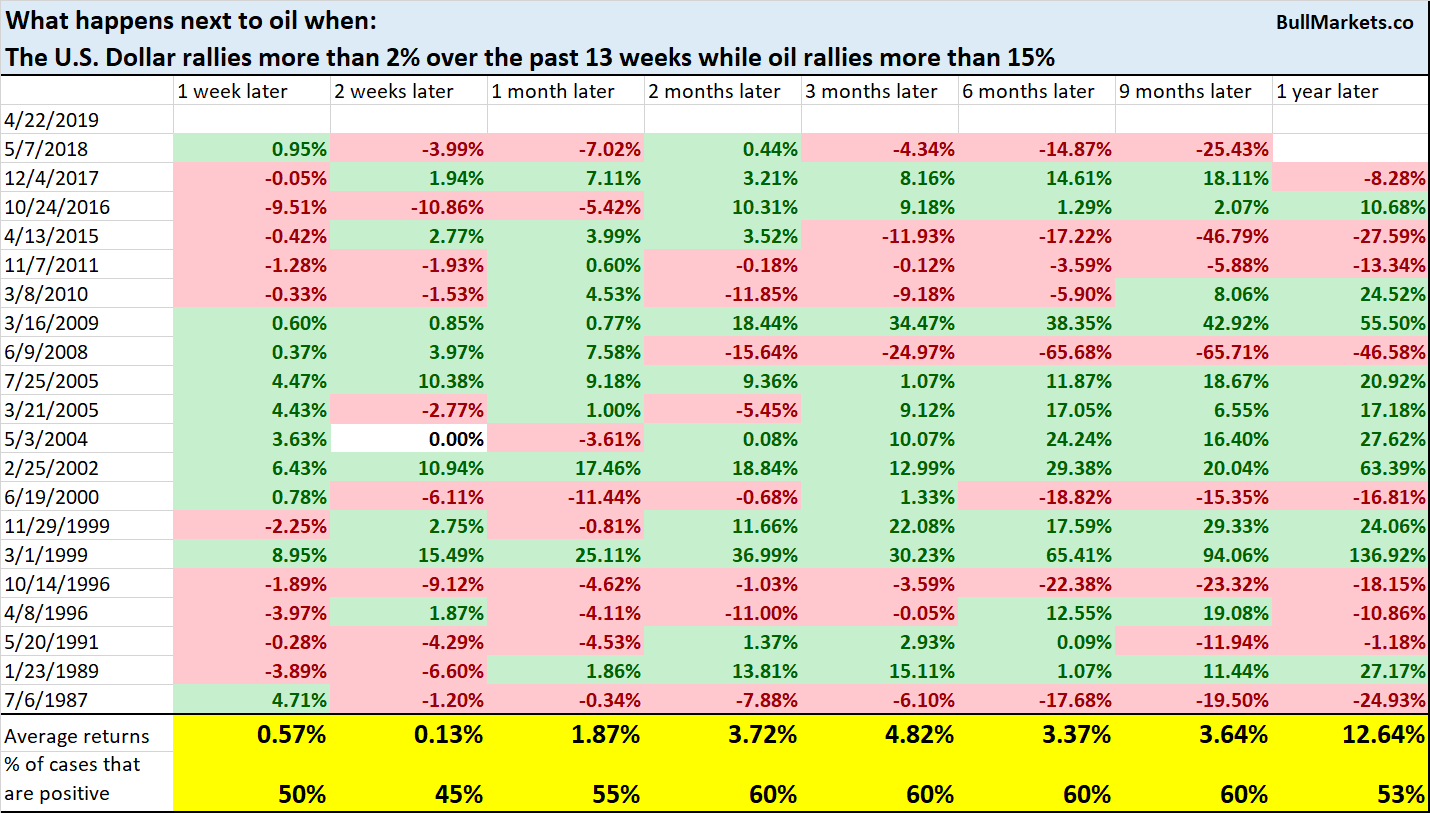
Here’s what happens next to oil when it rallies more than 15% over the past 13 weeks while the USD rallies more than 2%.
Here’s what happens next to the USD.
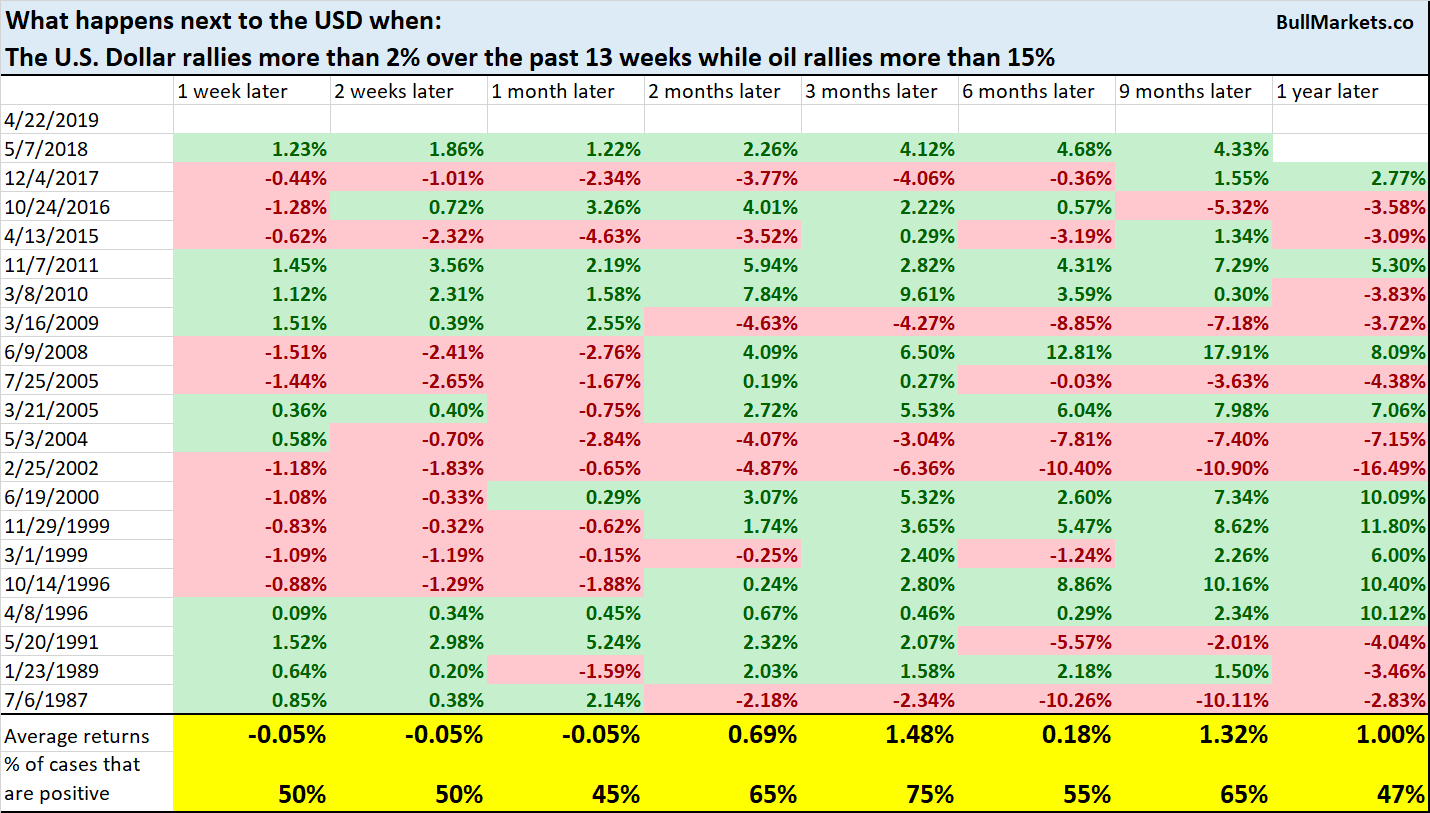
Once again, not “unprecedented” or consistently bearish for oil
Value Line Geometric Index
The Value Line Geometric Index is an equal-weighted index containing 1675 stocks from the U.S. and Canada.
The Value Line Geometric Index has diverged from the S&P 500 recently.

Is this bad for the stock market. After all, this is how the dot-com bubble played out.

Here’s what happens next to the S&P when the Value Line Geometric Index rises less than 1% over the past 2 months while the S&P rallies more than +5%
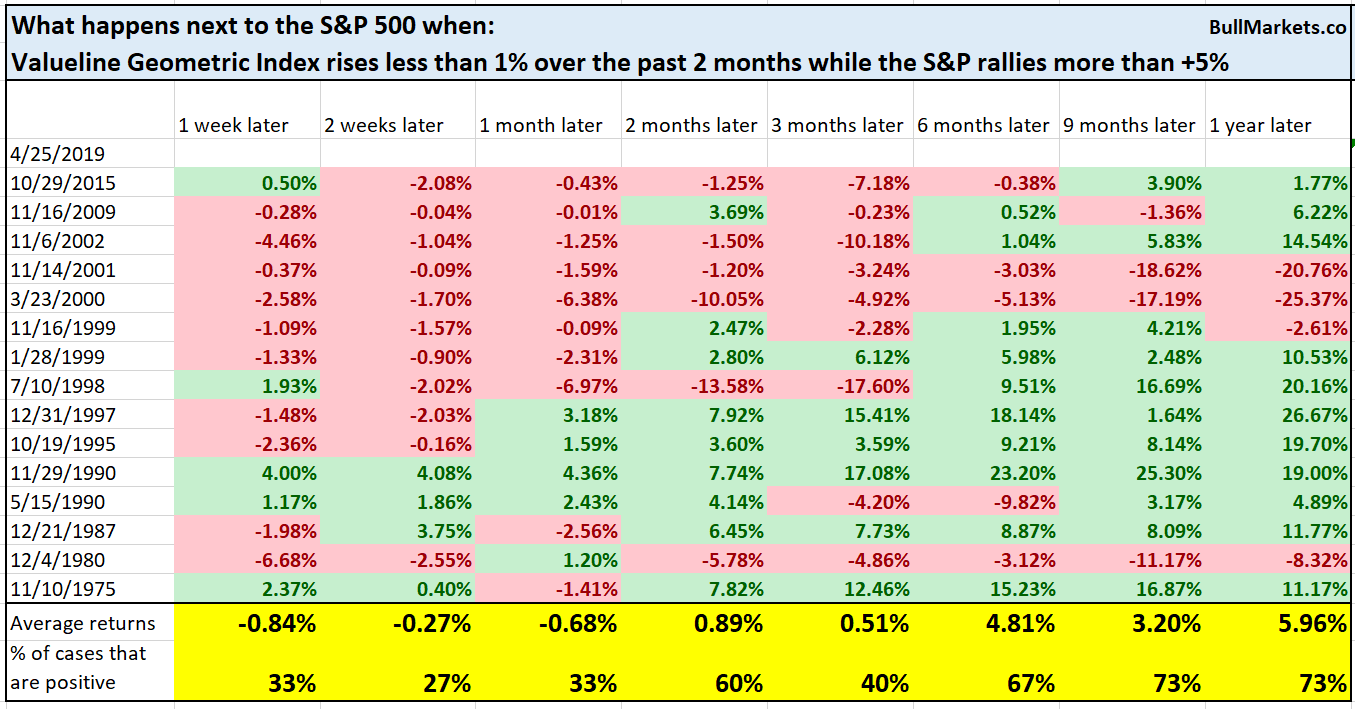
You can see that while this isn’t consistently long term bearish for the stock market, it is mostly short term bearish.
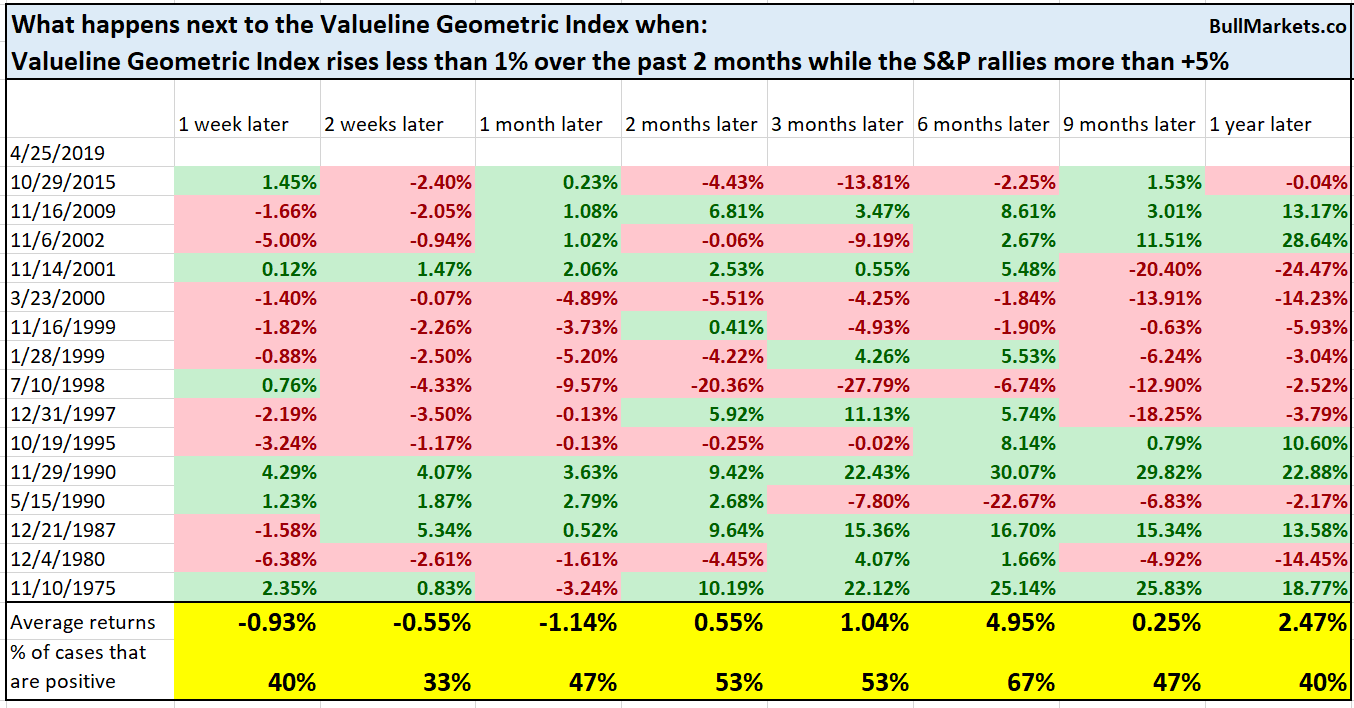
Here’s what happens next to the Value Line Geometric Index itself.
Oil’s near perfect correlation
Oil’s 20 week correlation is almost 1-to-1 against the S&P.

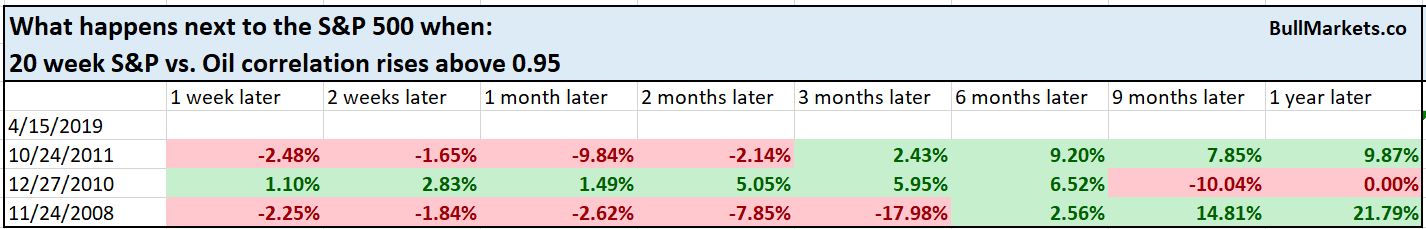
Here’s what happens next to the S&P when the 20-week S&P vs oil correlation rises above 0.95
Here’s what happens next to oil
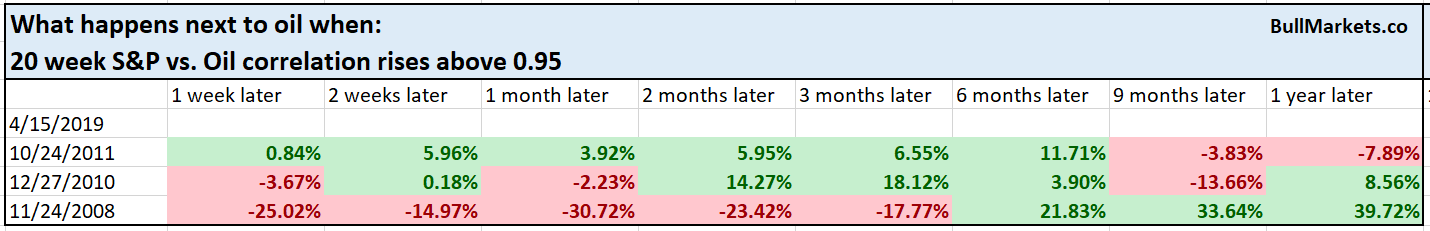
N=3, so we can’t draw any conclusions from this. But it’s worth nothing that such strong correlation has only existed after the financial crisis.
Standard deviation
I look at Bollinger Bands® not for its ability to predict reversals in the market, but to see how volatile the stock market has been recently. Bollinger Bands use standard deviations, which is a measure of volatility.
Bollinger Bands usually widen significantly when the stock market is falling because the stock market “takes the staircase up and the elevator down”. You don’t often see a significantly widening Bollinger Band when the market rallies.
And that’s exactly what’s happening right now. Bollinger Bands are widening because the stock market is rallying.

Here’s what happens next to the S&P when its 20 week standard deviation is more than 4.8% of its value, while the S&P is higher today than where it was 20 weeks ago (i.e. widening bands because of a surge).
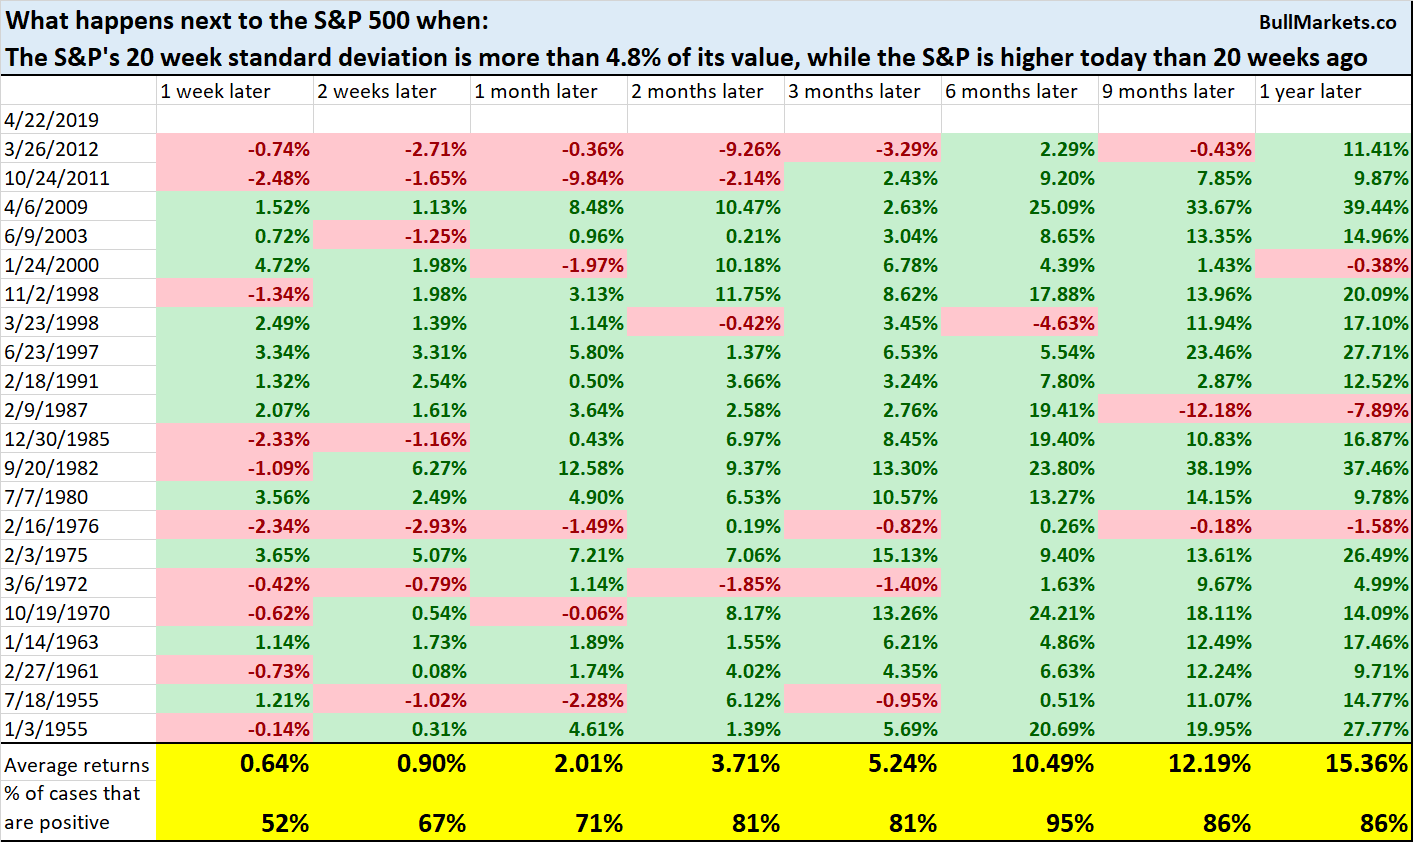
Mostly bullish 6 months later.
4 consecutive months
April is almost over. Barring a huge crash tomorrow, the S&P is going to be up 4 months in a row.
Here’s what happens next to the S&P when it goes up in January, February, March, and April.
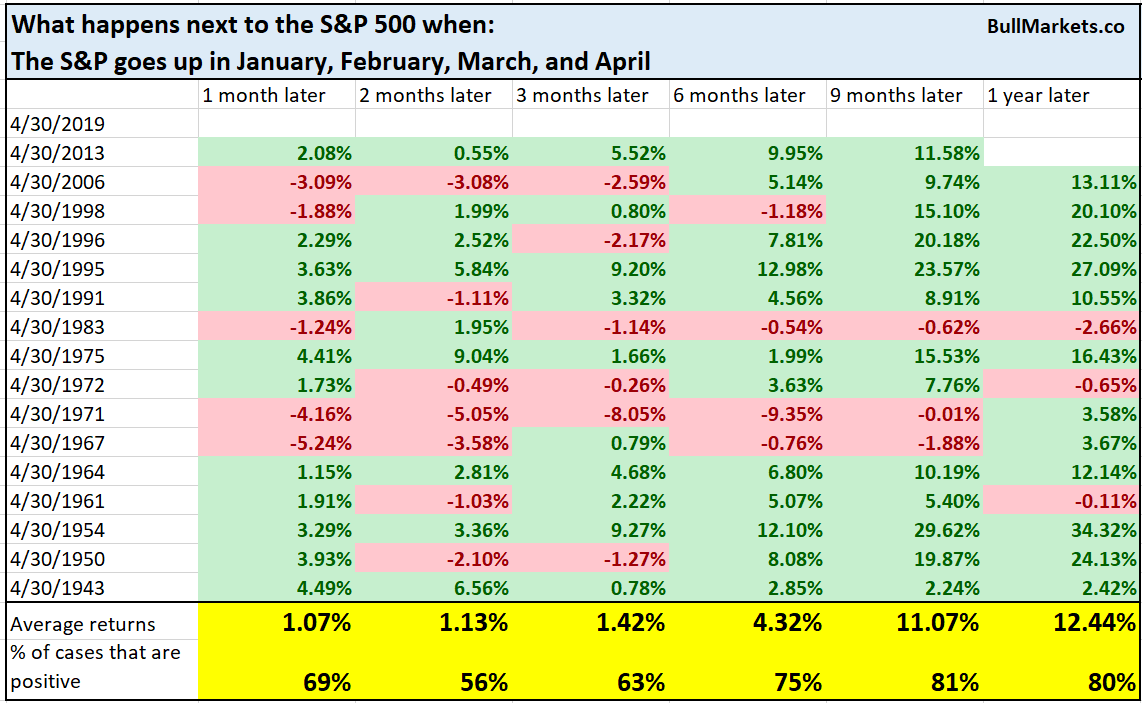
Mostly bullish, and the 9-12 month bearish cases only saw small losses.
What if we want to look at all cases in which the S&P rallied 4 months in a row, and not just the January-April ones?
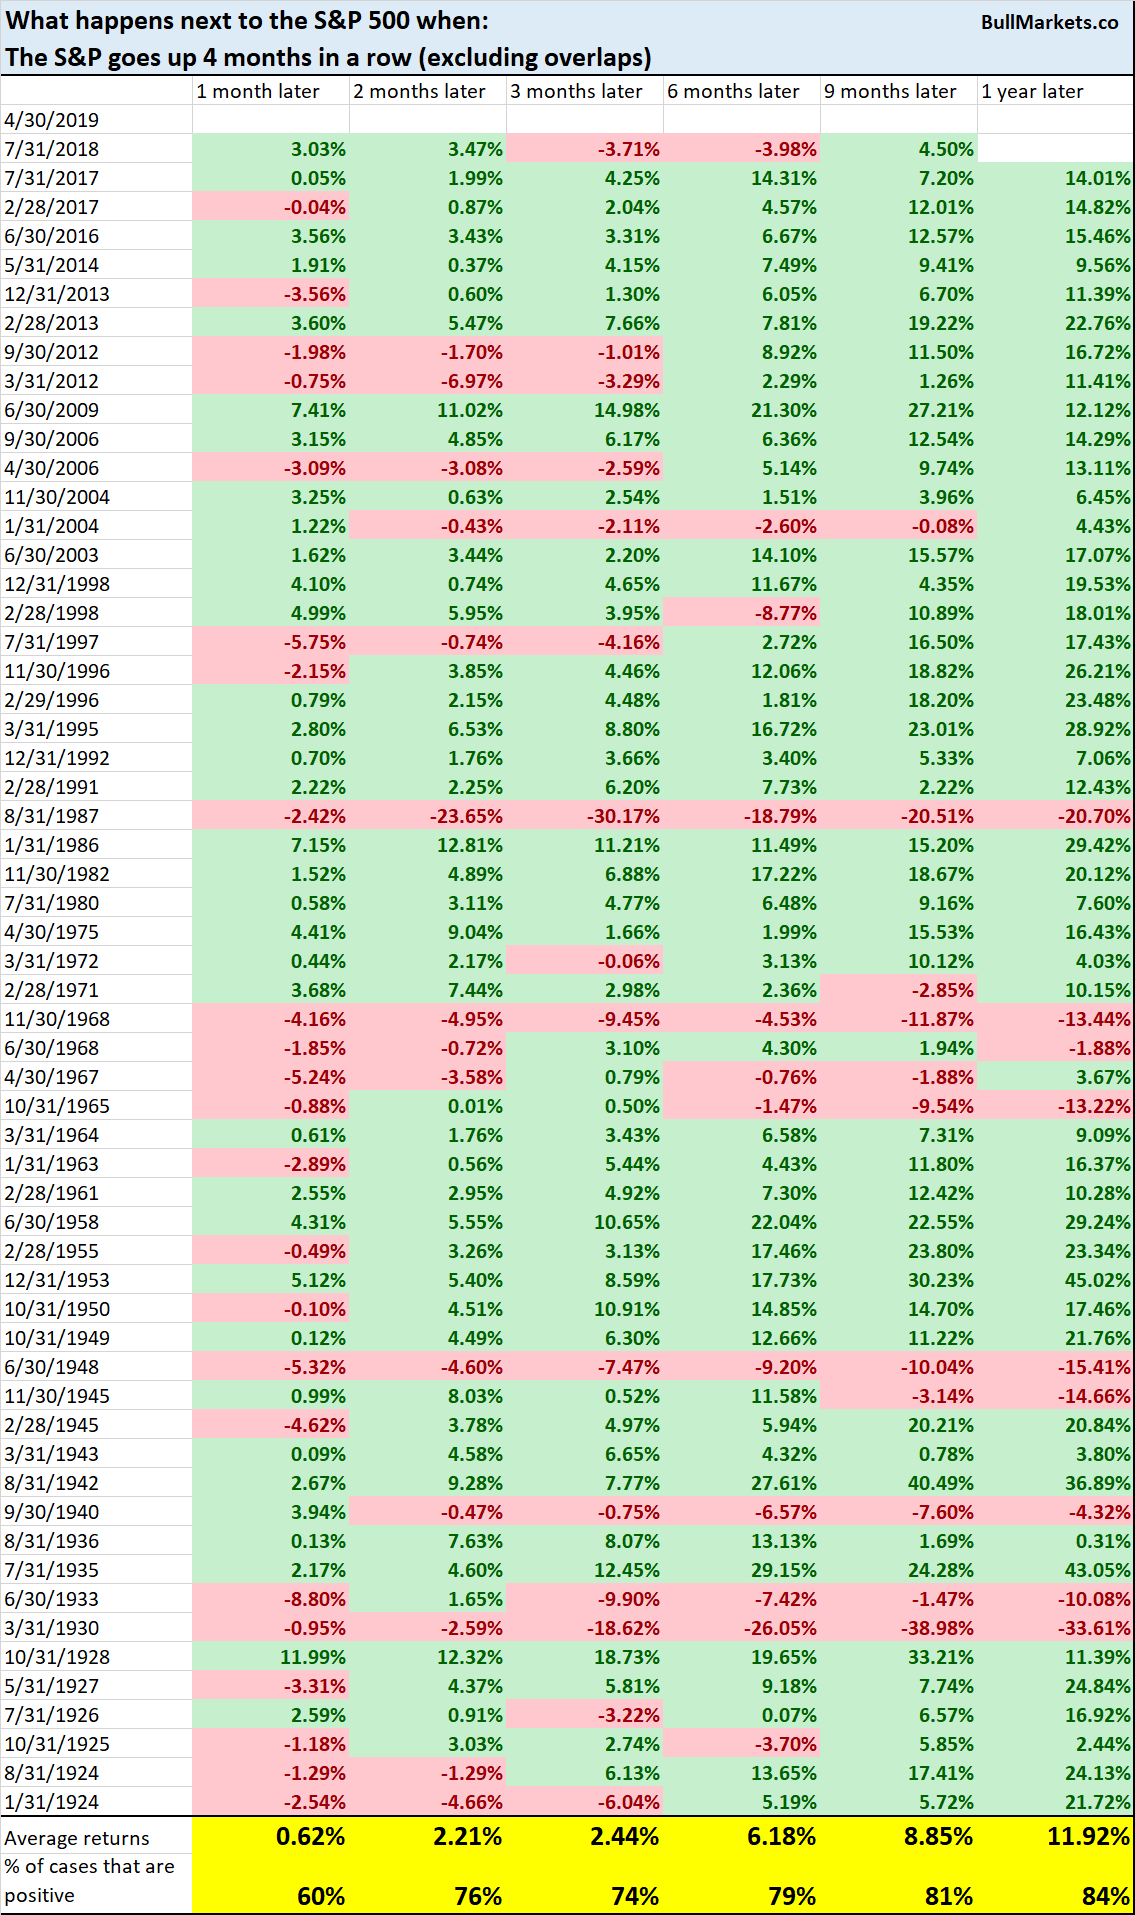
Once again, more bullish than bearish.
*Seasonality factors are of tertiary importance.
Baltic Dry Index
2 months ago a lot of market pundits were talking about the “collapsing Baltic Dry Index” and its bearish implications for the economy/stock market. We looked at it multiple times (here, here and here) repeatedly came to the conclusion that this was not a useful economic indicator for market timing.
*The Baltic Dry Index is a measure for global shipping, which is supposed to measure the health of international trade.
Now that the Baltic Dry Index is improving, nobody is talking about it. Bad news sells and good news doesn’t.
You can see that the Baltic Dry Index has now closed above its 100 day moving average for the first time since October 2018.

Here’s what happens next to the S&P when the Baltic Dry Index rises above its 100 dma for the first time in 3 months.
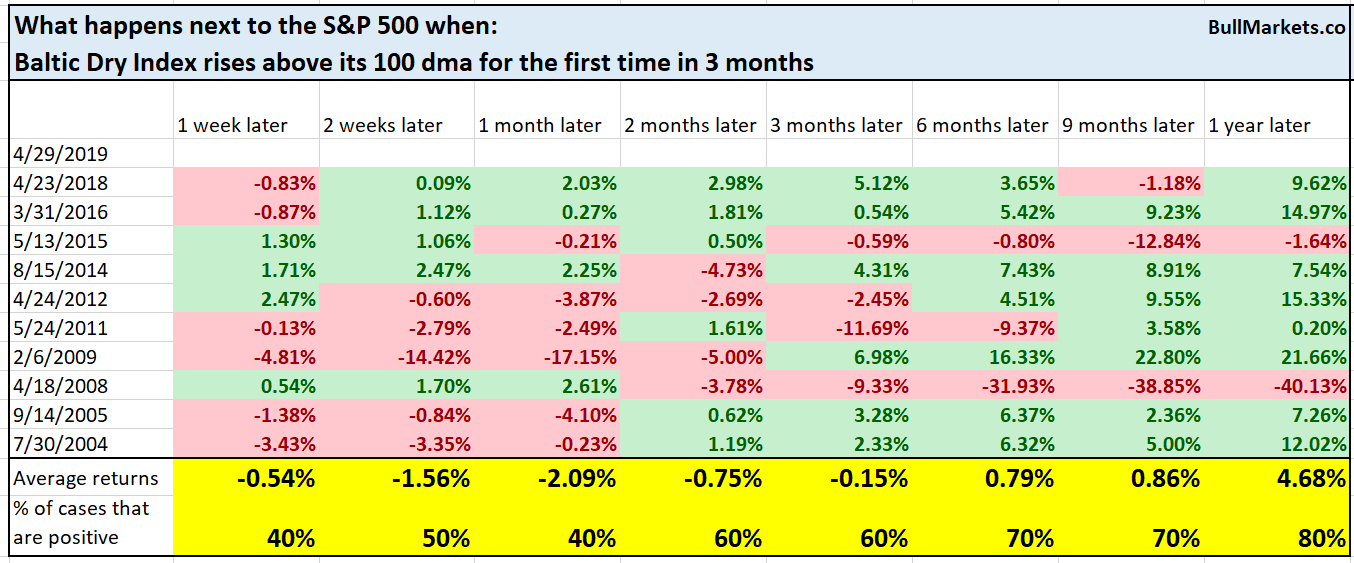
Not consistently long term bearish, although there is a slight short term bearish lean.
Think differently
I’ve noticed a trend among the financial community. More and more people are doing podcasts, interviews, blogs, etc. And while all of these podcasts, interviews, and blogs claim to give you access to “the brightest minds” in finance, not many of these expert predictions actually outperform buy and hold.
Most of these experts are really good at saying things that sound “smart” (look at all these fancy charts and indicators!) without actually being smart (i.e. outperforming the S&P).
- Buy value stocks, buy emerging markets, short the S&P
- Long gold (because gold is extremely undervalued relative to stocks).
- Short the USD (hey, another round of QE is on its way!)
- Economic growth is slowing down!
- XYZ indicator diverging from the S&P!
It’s a well known fact that most professionals and hedge funds don’t outperform buy and hold. This means that if you want to be better than average, you must think and use strategies that not many others are using. Otherwise you’ll end up like the rest of them – guys who know how to say “smart things” without actually outperforming.
So why don’t most people think differently? Because thinking differently won’t make you popular. If you aren’t popular, you won’t get mentioned in the media, get interviewed by other gurus, etc. In other words, not good for sales.
If you’ve noticed a theme here at Bull Markets, it’s that we don’t care for conventional thinking. And nor do we care about being popular. In trading as in life, you can either optimize for popularity or you can optimize for trading results. You can’t optimize for both.
So don’t feel bad if you’re not a financial insider. They don’t know more than you do. Outsiders always win. From someone who is actually smart (this guy makes $30 million a year):
*No, this is not a paid endorsement. I’m just a big fan of Sam Ovens.
Conclusion
Here is our discretionary market outlook:
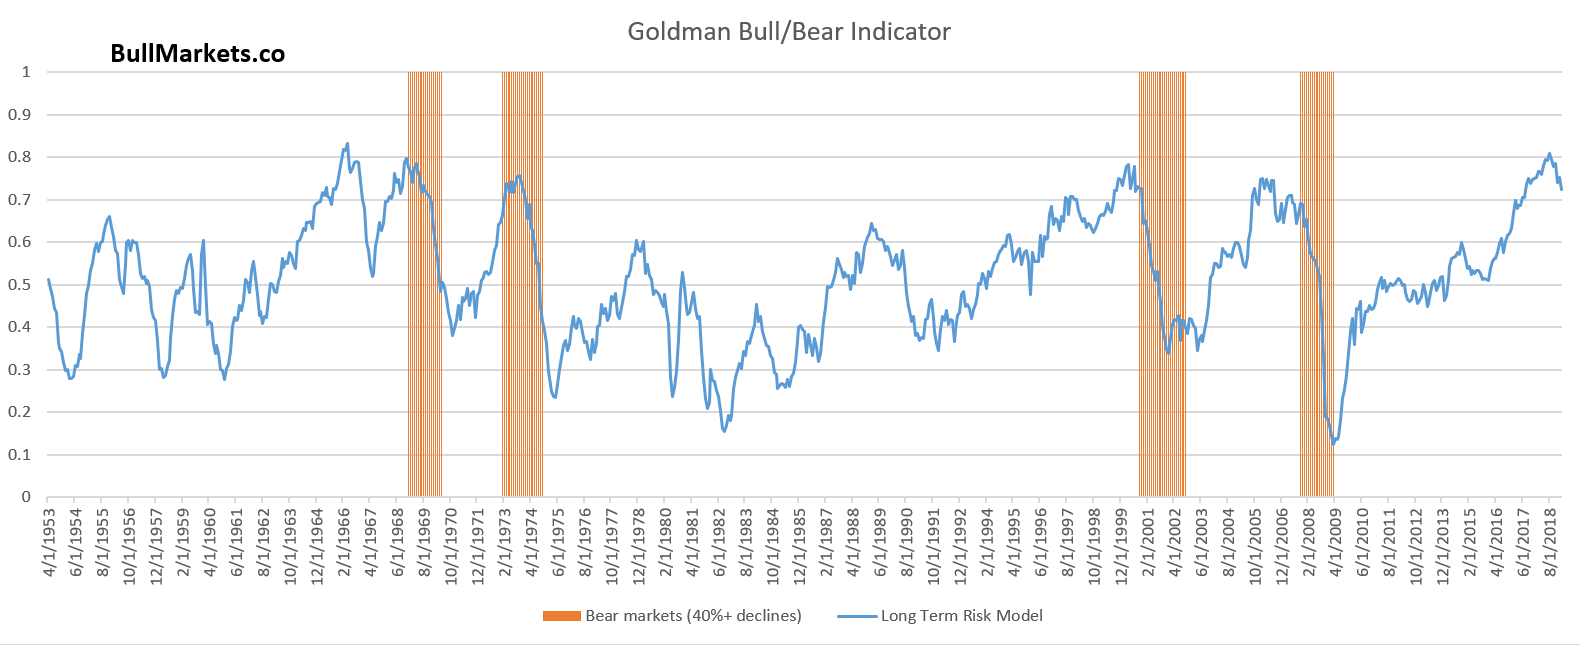
- The U.S. stock market’s long term risk: reward is no longer bullish. In a most optimistic scenario, the bull market probably has 1 year left. Long term risk:reward is more important than trying to predict exact tops and bottoms.
- The medium-term direction (e.g. next 6-9 months) is mostly mixed, although there is a bullish lean.
- We don’t predict the short term because the short term is always extremely random, no matter how much conviction you think you have. Focus on the medium-long term.
Goldman Sachs’ Bull/Bear Indicator demonstrates that risk: reward does favor long term bears.