The stock market is too high. The fundamentals don’t support these heights. This rally is completely “fake” because it has been “manipulated.” The market is in “nosebleed” territory. We are in a blow-off rally. The market is about to crash. Yes, we have heard it all for months now. Maybe even for years. And, such perspectives have caused many to miss one of the best rallies we have seen in years, as they expect the market to top “any day now.”

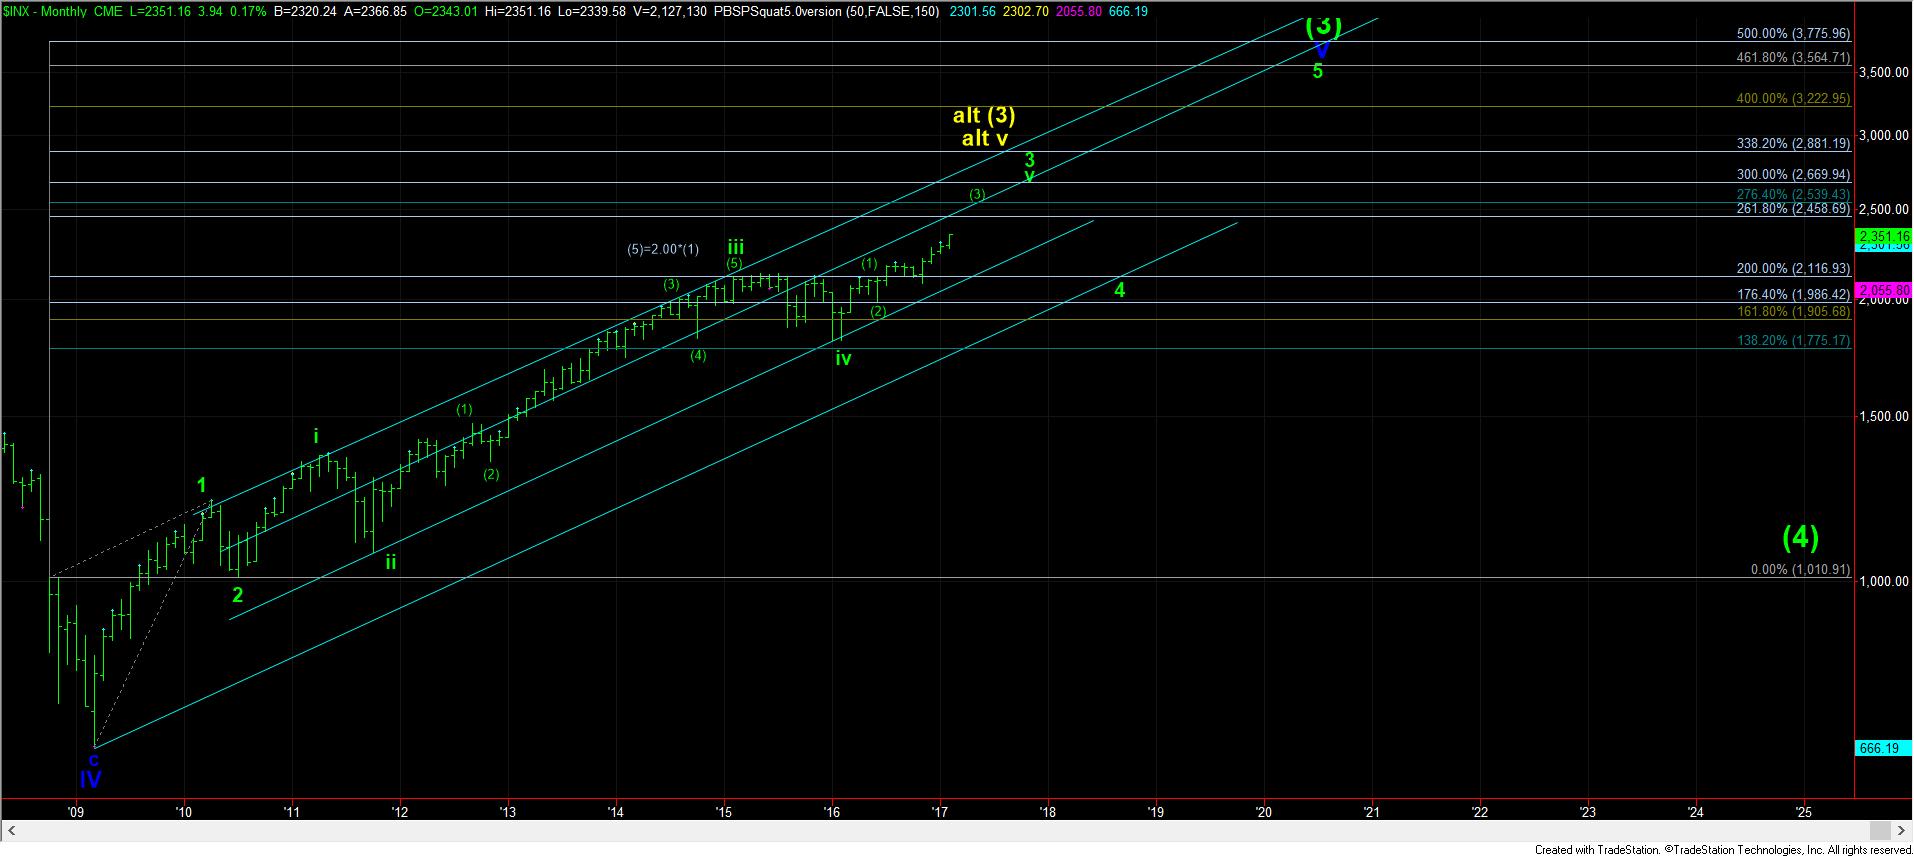
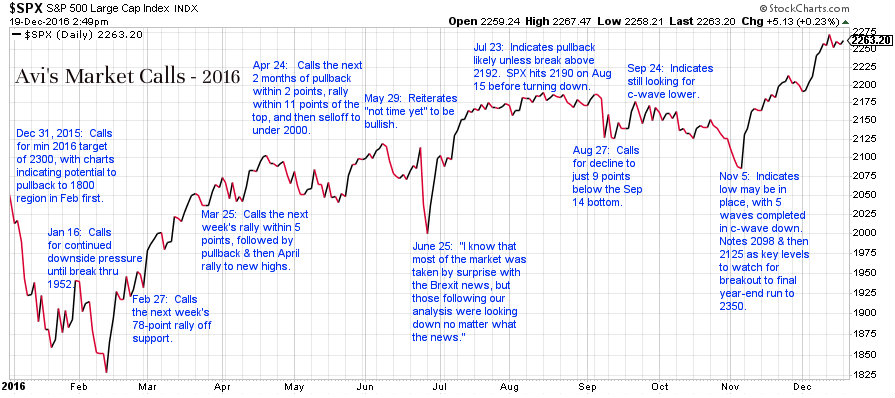
But, the simple truth is that the market is in the heart of what us Elliotticians call a “3rd wave”, and they are relentless and the most powerful segment of a 5-wave Elliott structure. In fact, we have been within the heart of a 3rd wave since early November when we went against the common “market-think” and called for a strong rally to 2300 and beyond on the S&P 500 (SPX), even though Trump won the election. But, it also means that we still have to complete waves 3, 4 and 5 before a long-term top is seen, as I have been noting since early 2016, which you can see in a chart of our market calls in the link below.

While I have clearly been quite bullish since February of 2016, it seems I was not bullish enough over the last few weeks. Although my target has been 2400-2440 on the SPX for this current run, I had initially expected some kind of pullback this month before we made the run towards my target. But, with so many market participants continually shorting this market, thinking it is about to crash, the short covering has certainly propelled us higher and faster than even I had immediately expected.

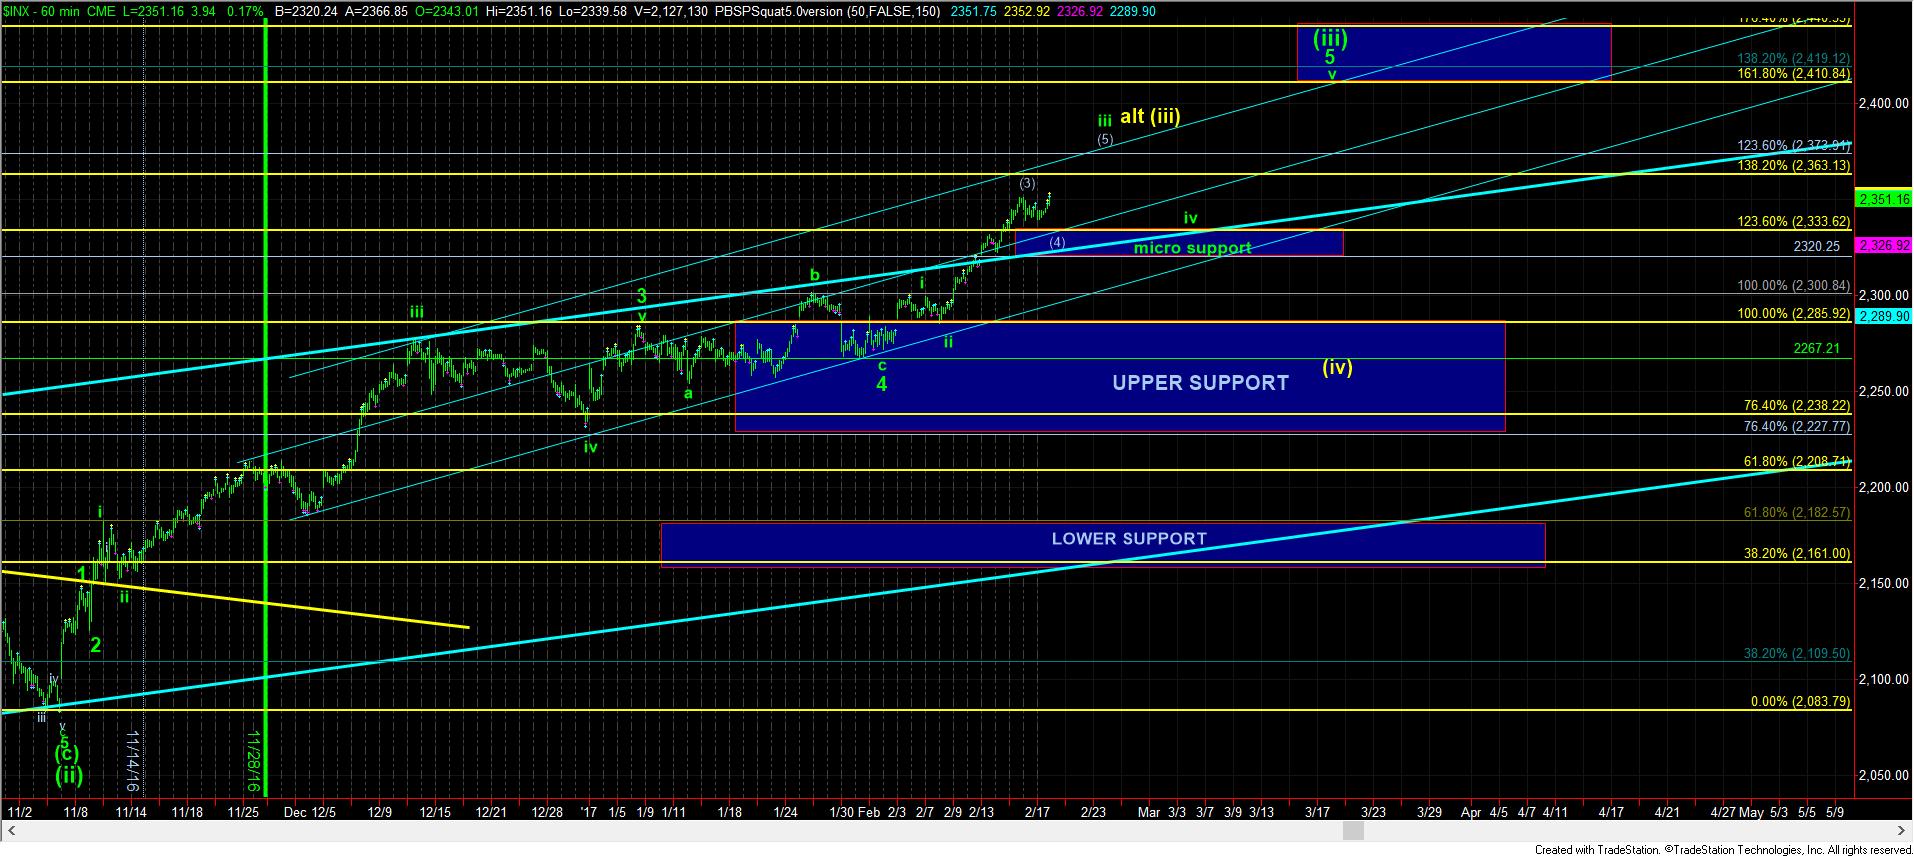
Due to the fact that we went directly higher without a pullback suggests that we MAY come up a bit short of our ideal target region for this rally segment. As you can see from my attached 60-minute chart, as long as we hold the 2320/30 micro support zone, I expect at least one more rally towards the 2370 region on the SPX. However, as I have it labeled in yellow, that could be all we get on this current rally segment.
Yet, my “preference” is still that the next high we strike will only provide us with a pullback to retest the upper micro-support region between 2320/30, setting us up for the final push higher to 2400 in mid-March. But, again, due to the direct nature of this rally, I am less confident about that potential at this time, although it really fits best within the overall structure.

Clearly, the market has not seen much in the way of a pullback in quite some time. However, I foresee that as ending quite abruptly once we have a confirmed wave (iii) completed, whether it be from the 2370 region or the more extended 2410/40 region. You see, we follow a theory of alternation when analyzing patterns using Elliott Wave analysis. When the 2nd wave is a sideways and long consolidation, as we had from August to early November of 2016, we expect the 4th wave to be a sharp drop and a bit deeper.
Therefore, once this 3rd wave segment completes, I expect volatility to return to the market and strongly. In fact, I am quite certain you will hear calls that we have struck a long-term top in the equity market and that we are going to crash. However, I believe there is a low probability for that to be the case. But, I can assure you that many will believe it to be the case, and you will likely be bombarded by the media with such expectations.
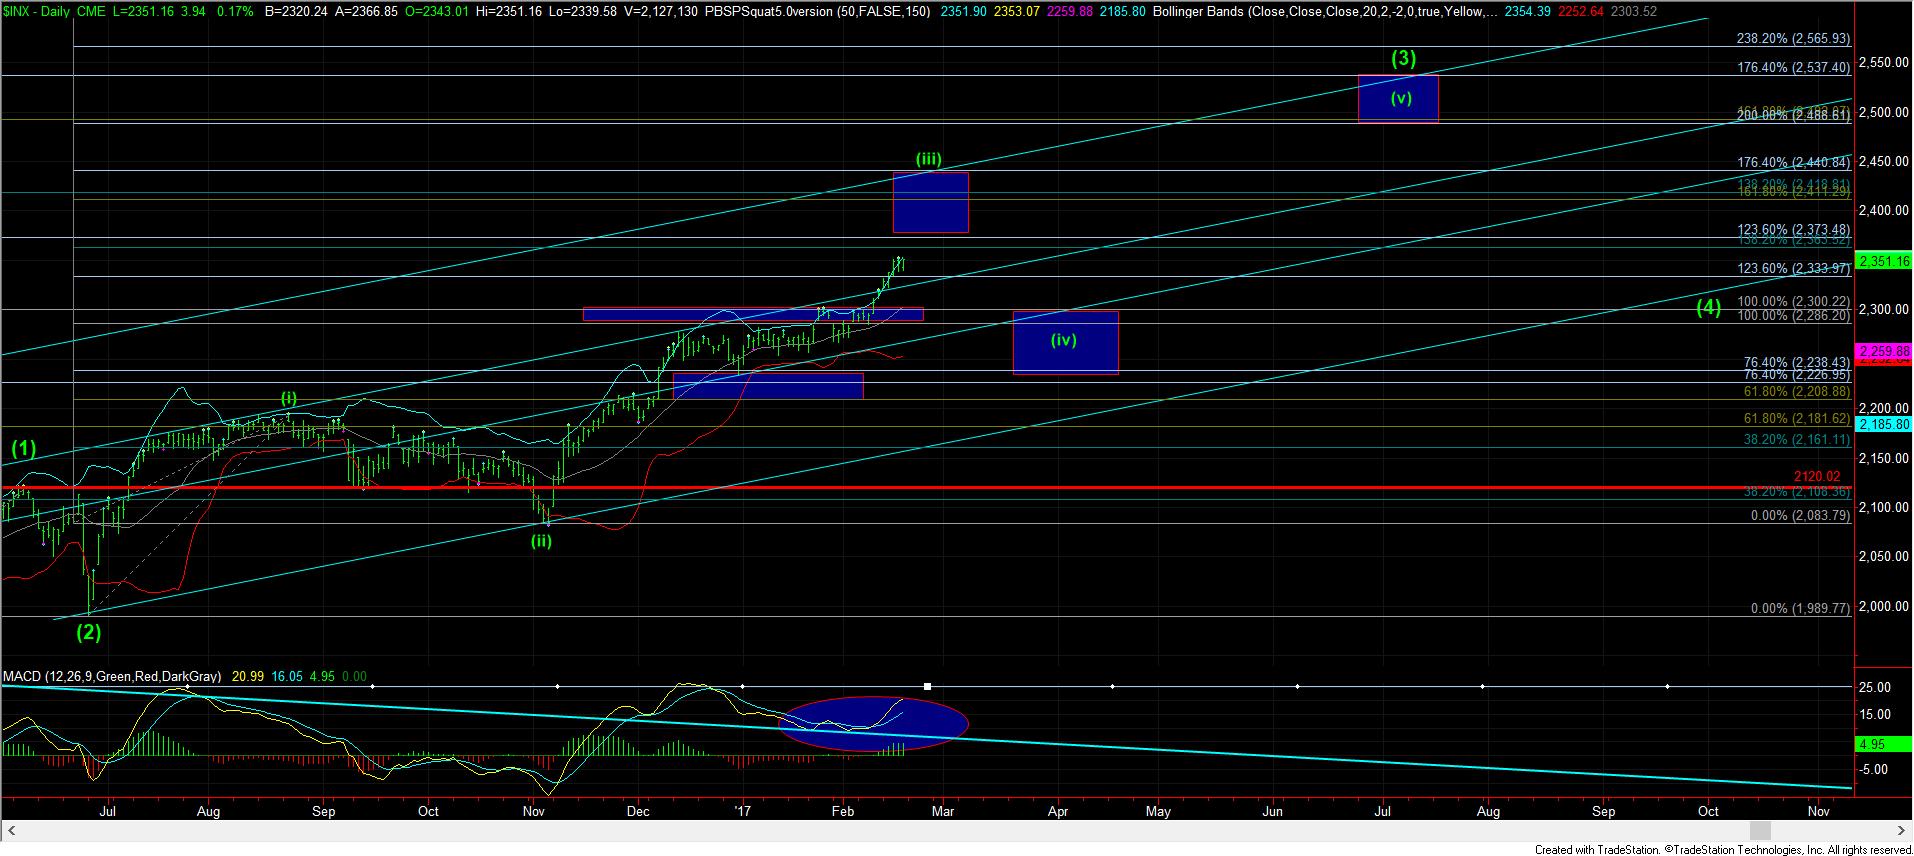
Rather, I simply believe we will see a very strong pullback in the market, potentially back to the 2240-2300 region on the SPX (depending upon how high this rally takes us). That pullback will then set up the next rally phase to the 2500 region, which will likely complete as we approach the summer, or maybe even early on into the summer, as you can see from the attached daily chart.
Again, I want to prepare you for the expected market calls you will certainly hear within the next month or two about the market hitting a major top. You will likely hear it over the next few months, and then again in the early fall, after we complete our next rally phase. But, my expectation is that we will not likely see a major top to this market until the end of 2017 or early 2018, after which time we can experience a 15-25% correction. Until then, I expect we will attain our target set out years ago in the 2537-2611 region. (Although, I still maintain a smaller probability at this time that we could see a blow off rally taking us as high as 2800 by early next year).
