S&P 500 (SPY (NYSE:SPY)
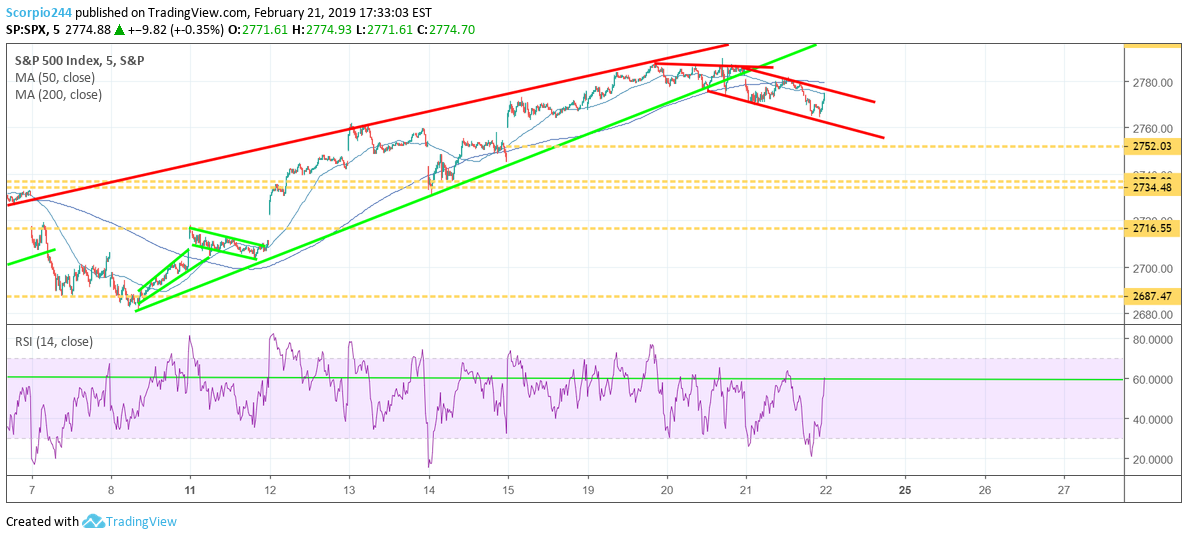
Stocks finished February 21 lower by about 35 bps. The good news about today’s trading session is that the S&P 500 finished off its lows. The bad news is that now there is a downtrend in the index. Again, I continue to believe that the S&P 500 is heading towards the gap at 2,753.
NASDAQ (Invesco QQQ Trust Series 1 (NASDAQ:QQQ))
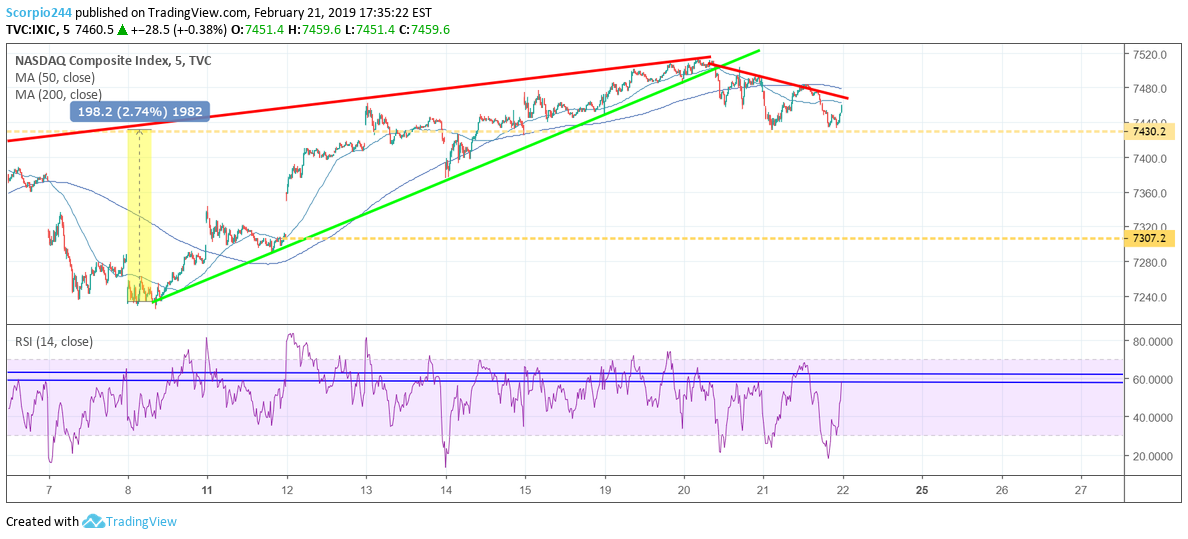
Additionally, the NASDAQ also fell today but managed to find some support around 7,430. Again like the S&P 500, there is now a downtrend in the index. A drop below support sends the index lower towards 7,300.
VIX
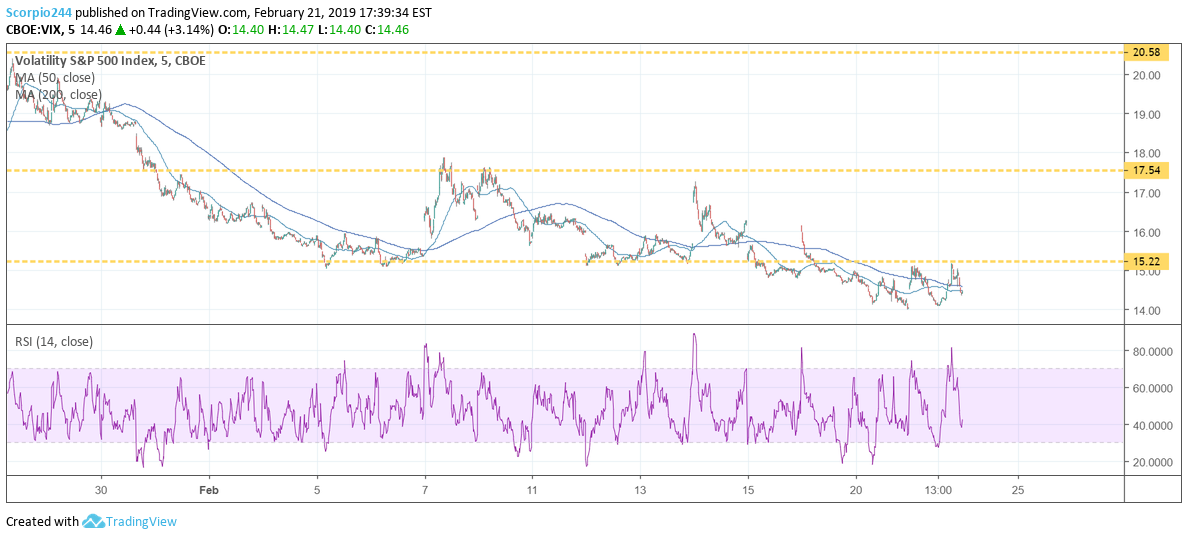
Interestingly the VIX is bouncing up against resistance at 15.25. A rise above resistance triggers the sell-off in equities and an increase in the VIX to around 17.25.
Everything continues to point to equity prices that are likely to continue to fall over the next few days. My thought process has been and still is that this a one or two-day event, with the indexes refilling the gaps. Can it extend beyond that? It could, although that is not what I am thinking about now, nor do I want to see happen. Let’s see what happens now.
Roku (NASDAQ:ROKU)
Roku’s results look ok. The first quarter guidance is just a hair shy of estimates at $187.5 million at the mid-point versus estimates of $188.75. Full-year revenue guidance was strong at $1.0125 billion at the mid-point versus estimates of $981.7 million.
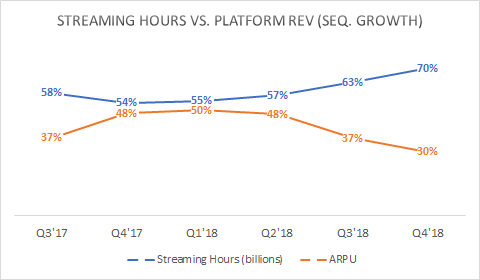
If one must nit-pick, I would continue to point to the slowing ARPU despite increasing streaming hours. It just tells us that more time streaming time doesn’t translate to faster revenue growth.
The one thing that has always bothered me about the company is how Roku calculates their ARPU, which is very different from how others may calculate ARPU, like Facebook (NASDAQ:FB). Have you looked at how Roku calculates ARPU? Check it out.

Here is Facebook:

I have just never seen a company track ARPU the Roku way. Basically you take the sum of the last four quarter platform revenue, in this case $416.9 million. Then you average the fourth quarter 2018 active users which is 27.1 with the fourth quarter 2017 active users of 19.3, which equals 23.2. That is how you get the ARPU of $17.95.
I was taught in the early 2000s that monthly ARPU was usually, (Revenue / Users)/ 3 for the number of months in the quarter. Quarterly is how Facebook does it. If we do Roku’s ARPU the Facebook method for the fourth quarter it would be this: Platform revenue $151.4 million divided by active accounts of 27.1 million, which equals ARPU of $5.59. For the monthly ARPU divide by 3, and you get $1.86! Big difference in either case.
Here is a comparison of the traditional ways of measuring ARPU vs. the way Roku employs.
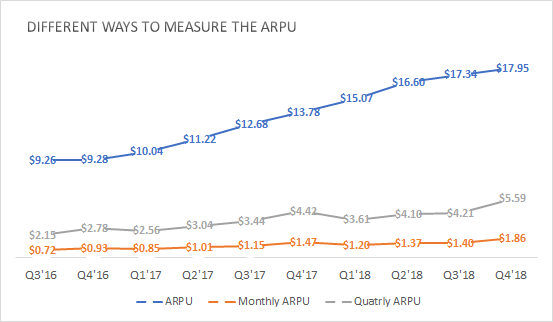
But you can see why they calculate ARPU their way, because it favors the most recent quarterly revenue growth but captures the mid-point of their subscribers base. Anyway, that is my thought, you decide for yourself or think about how’d you’d like. Maybe view is completely old school and wrong.
Blackberry (TO:BB)
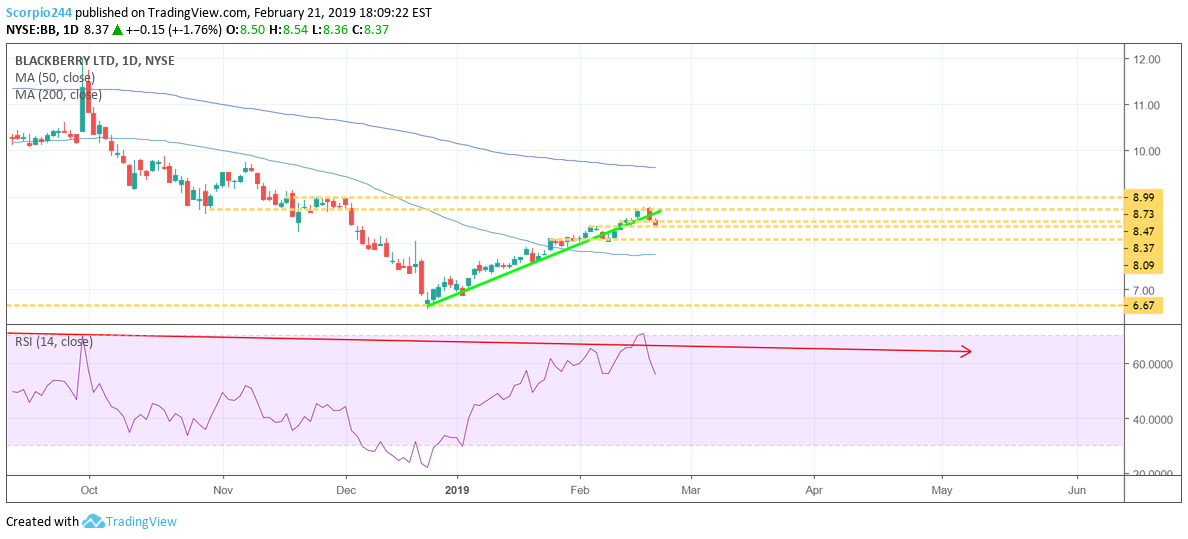
I hate to say it, but things just went from bad to worse for Blackberry. The stock fell below support at $8.50 and is now sitting on support around $8.35. If it goes below support the drop gets steeper and $8.10 looks very likely. It is not that stock can’t continue to rise over the longer-term, it is just that the short-term will likely not be smooth.
Alphabet (NASDAQ:GOOGL)
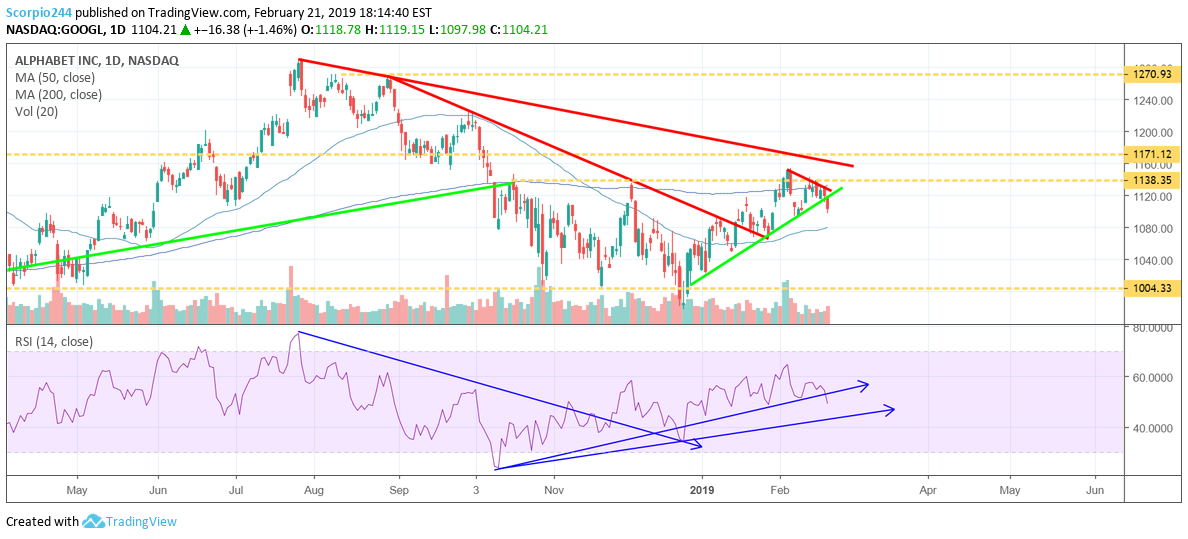
Alphabet looks like it may be ready to fall some. It fell through its uptrend today. Another day of declines tomorrow likely suggests that the uptrend is broken and a good chance the stock falls back to $1,000. We need to watch this one carefully.
Facebook (NASDAQ:FB)
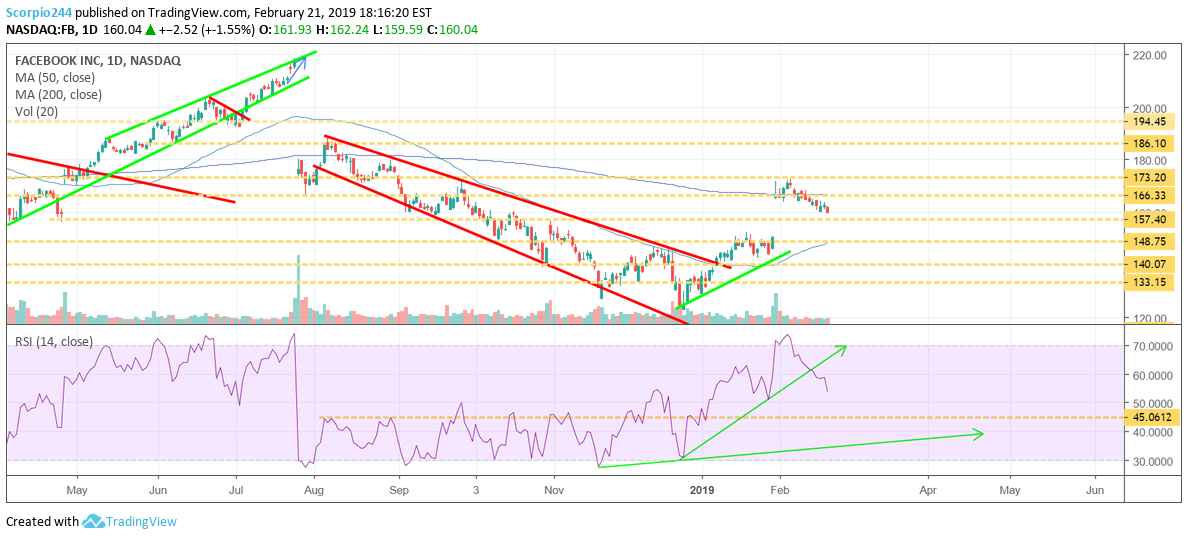
Speaking of Facebook it continues to head towards $157. Once it falls through that level –which I think it will, it goes down to $148.
Netflix (NASDAQ:NFLX)
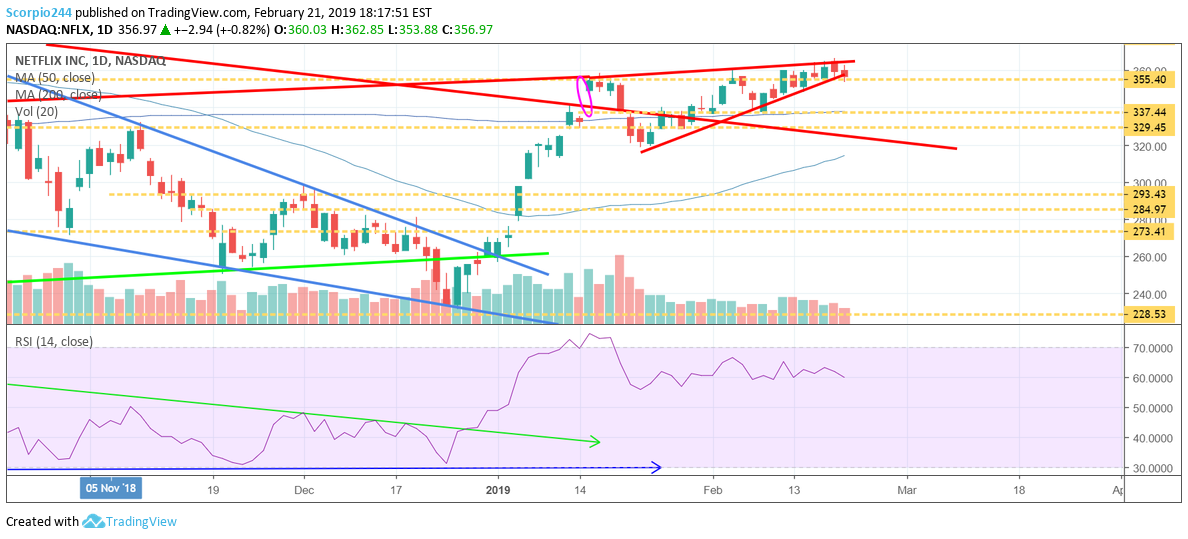
The setup for Netflix isn’t looking great either, with a rising wedge now clearly identified. I think it could result in a drop to around $335.
Amazon (NASDAQ:AMZN)
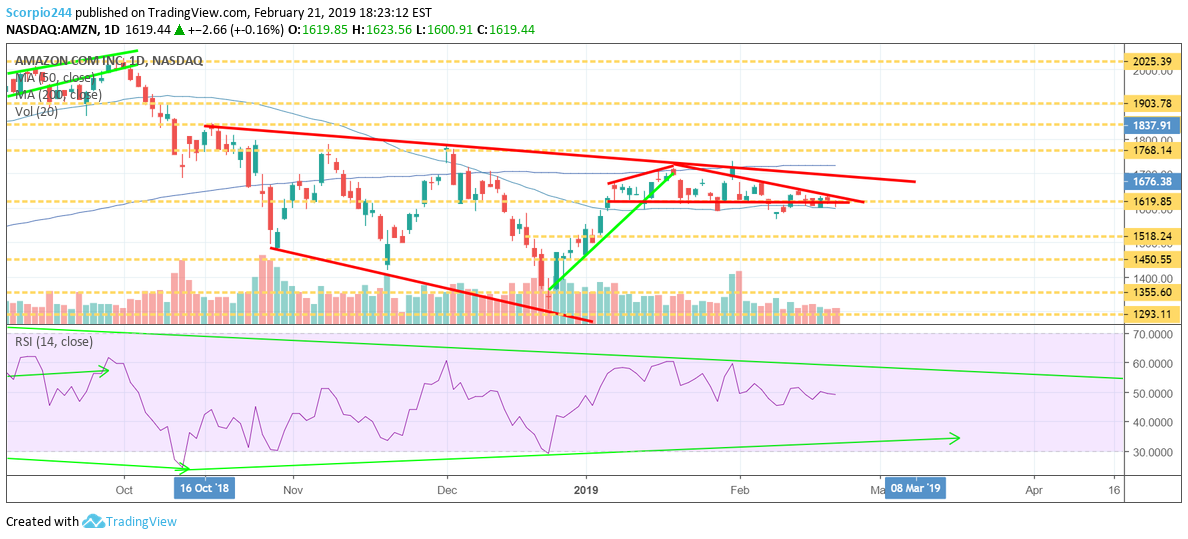
It has also become very clear that there is now a descending triangle forming in Amazon, a bearish pattern. That would suggest Amazon does indeed drop, I am looking for $1,520, but it could be more.
When you look at the FANG stocks, and where I see the stock headed it all points to lower price for equities in the days ahead. You can’t have 3 of the 10 top largest companies have steep drops without the entire market felling the impact.
Boeing (NYSE:BA)
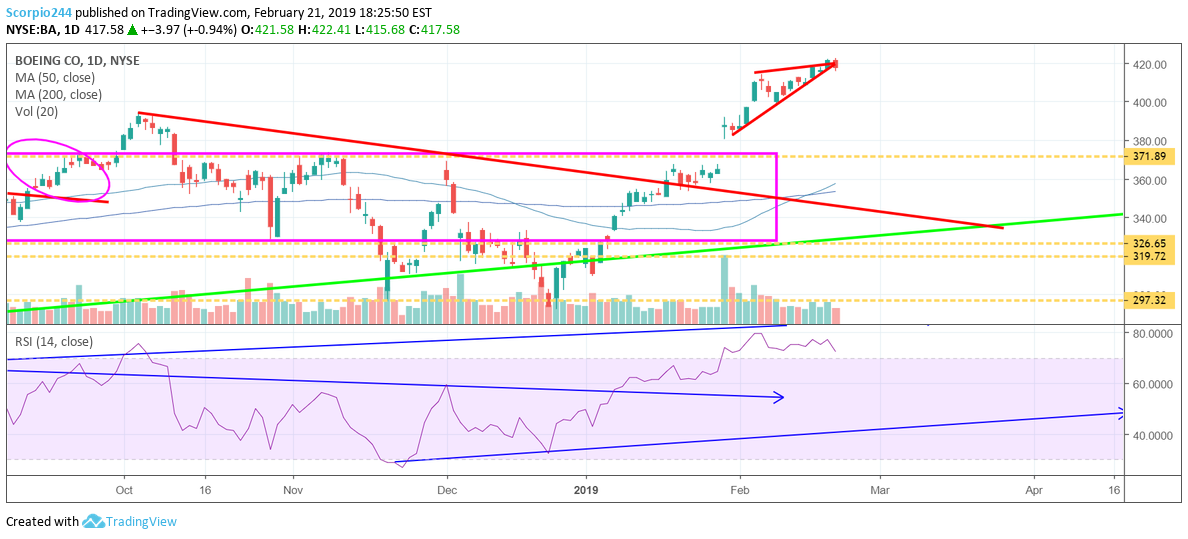
Then there is Boeing which also just moved outside of its rising wedge, and could result in stock filling the gap at $370.

