While you may not have been paying attention, some of the S&P 500's strongest sectors are already showing great strength and setting up for new breakout rallies. Over the past 30+ days, sector trends have rotated as the market volatility has increased. Right now, we are seeing strength in some of the same sectors that were leading the markets 60+ days ago: Discretionary, Comm Services, Technology, Energy, Financials, and Real Estate. If you are not paying attention to these trends, you may miss some of the best assets to trade given big sector ETF moves we’ve seen in early 2021.
Strongest Sectors Lead With Big Trends
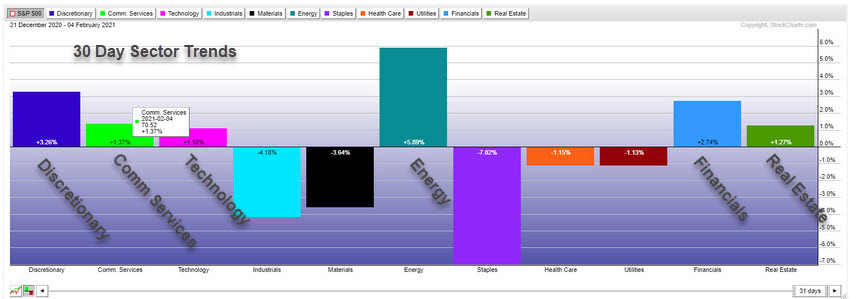
Existing trends, investor expectations, and government policies all work together to drive forward trends and expectations in sectors. Looking at the following 30-day sector comparison graph from www.StockCharts.com, we can see that Discretionary, Energy, and Financials have been the strongest sectors over the past 30+ days. Comm Services, Technology, and Real Estate are close behind.
It is important to understand how these sectors and rotational trends within these sectors create opportunity when breakout patterns become evident. With continued strength in these sectors, traders can attempt to take advantage of potentially explosive upside trends before the breakouts take place.

Home Construction Showing Potential – +12% or more
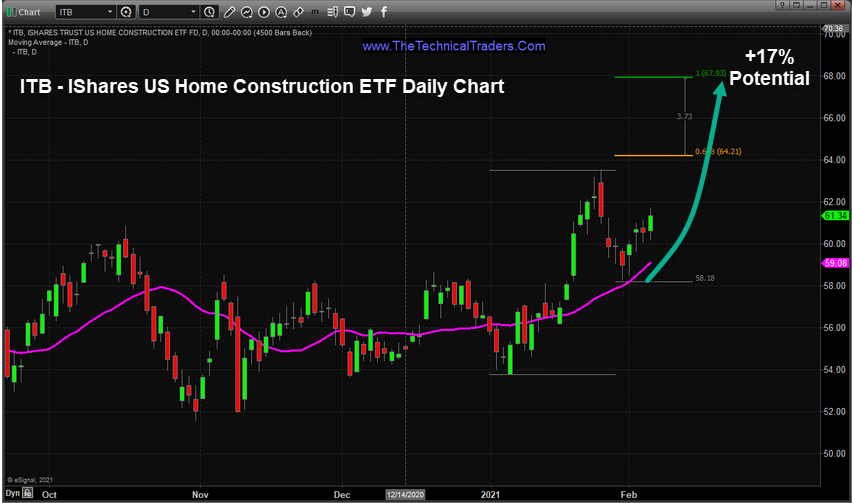
I will start off by illustrating the opportunities in iShares U.S. Home Construction ETF (NYSE:ITB). This Daily Chart highlights our use of the Fibonacci Extension tool to attempt to pinpoint upside price targets based on past price trends. The recent bottom near $58 suggests an upside price trend is likely to attempt to break above $64 while targeting $64.20 & $68. From the lows of this move, this represents a 17%+ rally where 12%+ of this move has yet to complete. The key to this upside breakout rally is for ITB to rally above $64.

Regional Banking May Breakout Much Higher- +10% or more
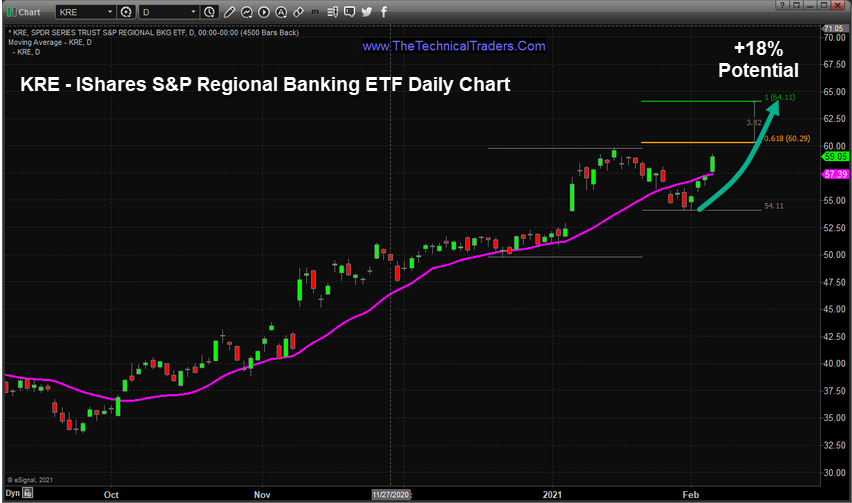
Next, we will focus on Regional Banking with SPDR® S&P Regional Banking ETF (NYSE:KRE). This Daily KRE chart, again, highlights our use of the Fibonacci Extension tool to attempt to pinpoint upside price targets based on past price trends. The recent bottom near $54 suggests an upside price trend is likely to attempt to break above $64 while targeting $60.00 & $63.60. From the lows of this move, this represents a 18%+ rally where 10%+ of this move has yet to complete. The key to this upside breakout rally is for KRE to rally above $60.
Take special notice of the recent upside price rally that has recovered nearly all of the recent downside price rotation. KRE appears to be trending higher quite nicely and may attempt a breakout rally very soon.

Energy Sector Still Has Great Potential – +11% or more
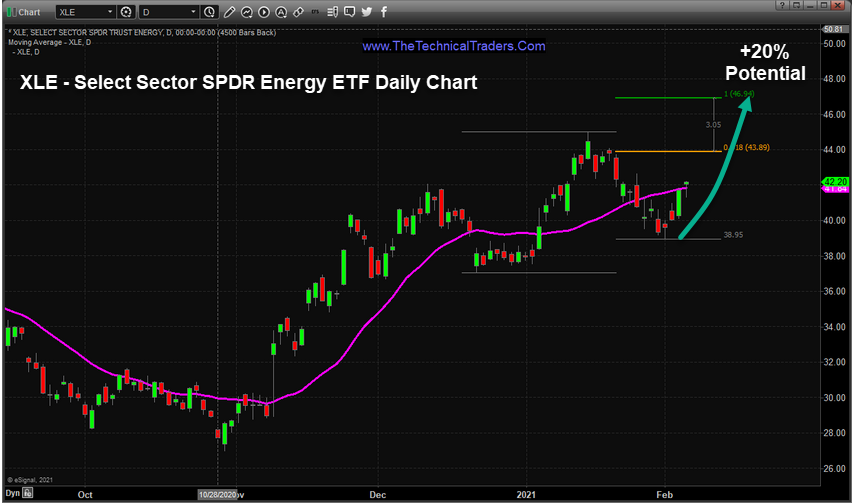
Last, we will focus on opportunities in Energy with the SPDR Energy ETF (NYSE:XLE). This Daily XLE chart highlights our use of the Fibonacci Extension tool to attempt to pinpoint upside price targets based on past price trends. The recent bottom near $39 suggests an upside price trend is likely to attempt to break above $43.80 while targeting $44 & $47. From the lows of this move, this represents a 20%+ rally where 11.5%+ of this move has yet to complete. The key to this upside breakout rally is for XLE to rally above $44.

The similarities of these setups/pending upside breakout trends are not by accident. The strongest market sectors have recently rotated downward and have begun to resume the upward price trends. When this happens, the Fibonacci price extension utility we use to highlight the next most logical upside price targets can become very accurate for trading targets. Additionally, the opportunities of these trends, ranging from 8% to 18% or more based on the current setups, provides some very real opportunities should these breakout trends continue higher.
Sector trends can become a very powerful tool for traders to consistently find and execute profitable trades in bigger trends. 2021 is going to be full of these types of trends and setups.
