COFFEEForty Year Trading Range: $41.50 to $337.50 per lb.
Speculative long positions in coffee increased 50 percent based on the latest COT report. Coffee provides more bang for the buck than most commodities. When it comes to risk-on investment coffee is a favorite. When the winds of speculation are blowing from the bull side major players will be onboard and long.
According to Brazil’s official crop forecaster CONAB, the country’s 2012 coffee crop is likely to be a record. The dry weather in Colombia is great news for the flowering of next season’s main crop. The country’s coffee production has not been able meet the 2007-2008 production of 12.5 million bags. Rains have slashed the country’s coffee output for three seasons in a row. Colombia is the world’s second largest producer of arabica coffee. According to ICAFE, the Costa Rican Coffee Institute the strong winds that were threatening the Costa Rican coffee crop have weakened considerably and caused little or no damage. Costa Rica’s coffee farmers are quite relieved.
Gas from coffee? No, not that kind of gas! It’s now possible to produce synthetic gas (syngas) from coffee processing plant waste. The syngas will be used for the production of electricity and heat or be converted to biofuel. In addition, researchers at the University of Missouri have developed an efficient way to extract oil from used coffee grounds. According to the research team, coffee grounds contain 10 – 18 percent oil by weight. Previously they ran into problems drying the grounds. They contain 70 percent water. The research team has engineered an extraction method that does not require drying the biomass. Can you imagine? We certainly have no shortage of used coffee grounds.
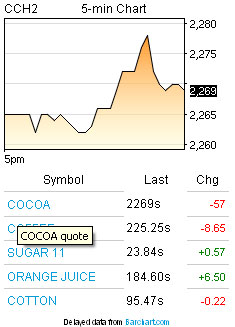
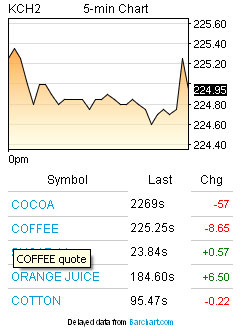
Weekly technical indications on Friday, January 13th: At this time the week’s trading range was 238.50-217.60, the last print is 234.80. The stochastic remains in buy mode. At 47.63 the RSI is higher than last week’s reading of 40.30. The M.A.C.D. histogram reads -0.23, higher than last week’s indication of -1.54. Trading well above the 9 bar moving average the market reached the center Bollinger band and is now trading between them. A weekly close at or below 215.65 in March coffee will turn the weekly trend down.
Do not trade without the use of protective strategies such as stops and or options.
COCOA
Forty Year Trading Range: $4.44 to $53.79 per tonneCocoa was one of few commodities that saw speculators increase their net short positions. Spec’s added 224 short contracts bringing the total to 9,694. Unlike many farm commodities, La Nina events tend to produce larger West African cocoa crops. Interestingly the majority of Ivory Coast’s cocoa belt has begun a second ten day period of no rain. The dry Harmattan wind could interfere with the crops development and curb output.
Cocoa prices in Ivory Coast’s cocoa growing areas have been rising ever so slightly. Concern is that there will not be enough cocoa in the near future. Cocoa arrivals at Ivorian ports for export have been falling sharply and are expected to continue falling in the weeks ahead. Not long ago I wrote that arrivals would fall in 2012 as the overhanging supply of cocoa from last season became depleted. Arrivals in February will tell the story.
The Ivory Coast’s main cocoa harvest comes to an end in March. Earlier if cocoa supplies dry up. Quality beans fit for export have become difficult to come by. Cocoa buyers are concerned they won’t be able to meet their contractual obligations. This has created tightness in supply and should push cocoa futures higher.
Has cocoa made it’s low? Fourth quarter cocoa grind figures are due to be released over the next couple of weeks. They could very well show an increase in demand is taking place in Europe and North America. The preceding information certainly leans towards the bull side of things. Not being one to join the crowd (the shorts) I will take to the sidelines and await opportunity.
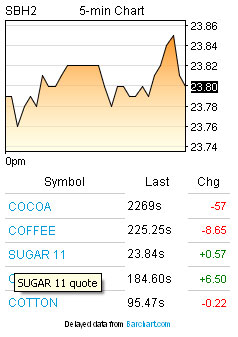
Weekly technical indications for Friday, January 13th: At this time the week’s trading range was 23.88-20.23, the last print is 22.70. The stochastic is in buy mode. RSI at 40.10 is higher than last week’s reading of 28.17. The M.A.C.D. histogram at -23.86 is higher than last week’s reading of -50.59. The week’s trading activity rallied the market beyond the 9 bar moving average. A weekly close at or above 21.56 in March cocoa futures will turn the weekly trend up.
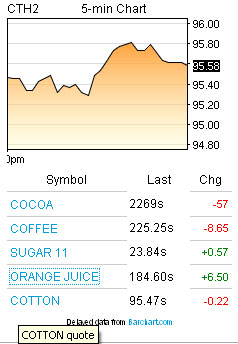
COTTON
Forty Year Trading Range: $26.84 to $227.00 per lb.Have you noticed how strong cotton has been lately. My favorite leading economic indicator is telling us that the economic situation is improving. Long positions in cotton rose the most since April of 2009. Speculators added 8,303 contracts. This brings their total longs to14,986.
Substitution of other crops for cotton this growing season could see U.S. cotton acreage fall near 12 percent. China is expected to move 15 to18 million bales into it’s strategic reserves. Cotton placed into China’s reserves is not in play. It’s like someone took half your marbles and hid them from you. The marbles still exist but you can’t get to them. As economic conditions continue to improve demand will increase. And when it does there will be a rebuilding of inventories. These factors could create tightness in supply and support higher cotton prices.
U.S. cotton exports have been healthy. Be it only for one reason, China. China’s buying has kept U.S. cotton exports ahead of the curve this marketing year. If it were not for Chinese imports there would have been extreme hardship for U.S. cotton exporters.
U.S. cotton exports for the week ending January 5th, 2012 were 92,800 running bales.
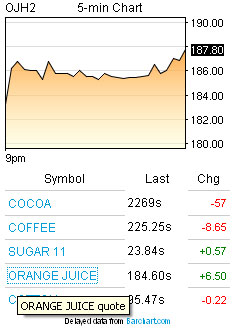
Weekly technical indications for Friday, January 13th: At this time the week’s trading range was 96.48-91.85, the last print is 95.86. The stochastic remains in buy mode. RSI at 46.36 is lower than last week’s reading of 47.68. The M.A.C.D. histogram at -0.37 is lower than last week’s indication of -0.1. The majority of this week’s trade took place above the 9 bar moving average and reached the center Bollinger band. I continue to expect surprises to be on the upside. A weekly close at or below 91.74 in March Cotton will turn the weekly trend down.
SUGAR
Forty Year Trading Range: 2.30 cents to 66.00 cents per lb.This shouldn’t come as any surprise. China is considering the purchase of two million tonnes of sugar. The government would purchase one million tonnes; the Guangzi Autonomous region would buy 600,000 tonnes and other authorities would purchase the balance of 400,000 tonnes. An alternate plan is being discussed that would place a price limit on the purchase but no limit to the amount of sugar that could be imported. Consider this if you will. China produces near 12 million tonnes of sugar each year. The country’s usage is near 14 million tonnes. Sugar imports make up the difference. China is re-inventing the wheel.
The USDA has put a group of its scientists to work helping sugar beet producers in the U.S. increase their yields, protect their crops from disease and increase their profitability. A large part of their work is focused on beet necrotic yellow vein virus (BNYVV). The virus causes a disease called rhizomania that depletes the sugar content of the beets after harvest. There is one dominant gene in sugar beet that protects the plant from rhizomania, but many strains of the virus have overcome this genetic resistance. Hopefully the scientists develop a sugar beet variety that stands up to this menace.
Though the world’s sugar supply is more than ample many traders are thinking in terms of increased demand. Increasing demand for motor fuel in Brazil could place more demand on the country’s sugar supply, diverting more sugar to ethanol production.
Did you ever wonder why sugar costs up to twice as much in the U.S. than it does elsewhere? The U.S. produces a large quantity of sugar. In fact we produce more sugar than most of the other growers in the world. The problem is that our country’s climate is not really suited to produce sugar efficiently. This makes it a costly crop to produce. U.S. sugar producers have made use of political clout over the years to receive a host of benefits from our government. These include, but are not limited to import quotas, price supports (otherwise known as free puts), subsidies and high tariffs on imported sugar. If the market were left alone to function as a free market we would be paying much less for sugar. It’s not surprising that high fructose corn syrup is the chief sweetener used in our foods now is it?
Weekly technical indications for Friday, January 13th: At this time the week’s trading range is 33.85-22.82, the last print is 23.23. The stochastic has flashed a sell signal. RSI at 42.37 is a smidgen higher than last week’s indication of 42.59. The M.A.C.D. histogram at -0.23 is higher than last week’s reading of -0.31. Until this market is out of it’s trading range the technical indicators should be faded. In other words when the indicators improve, sell; when they deteriorate, buy. A weekly close at or above 23.96 in March Sugar will turn the weekly trend up.