
Rallying mining stocks? Forget about them. Silver is the new cool kid in the neighborhood. Having rallied by almost 50 cents in just one day, silver stole the spotlight and seems to be ready to move much higher… Or much lower. Does anyone still fall for silver’s fake rallies? Based on the size of the rally and the corresponding volume, it certainly seems to be the case. But you don’t have to fall for it – that is if you prefer to analyze the market’s emotionality instead of acting on it. It’s not an easy thing to do, because each silver rally seems to be “it”. But what’s easy and what’s profitable is rarely the same thing.
Today’s analysis will be quite specific, because we already wrote about “the silver signal” several times in the past several days. We did emphasize our take on the silver market more than once, because the market itself provided us with the signal more than once.
First, there was the spike in the ratio of volumes between iShares Silver (NYSE:SLV) and SPDR Gold Shares (NYSE:GLD) (charts courtesy of stockcharts).
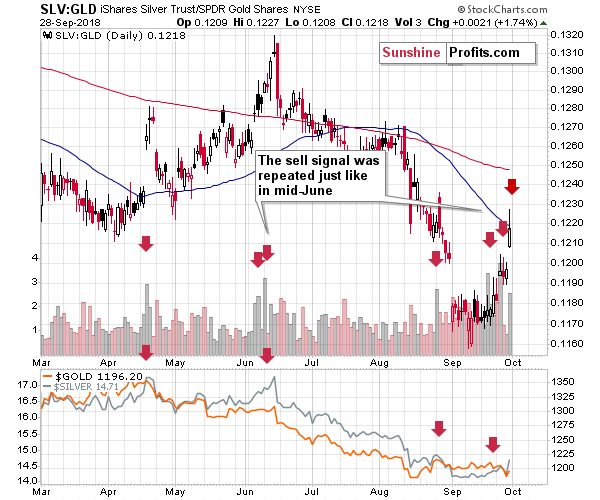
The red arrows mark cases when we saw huge volume spikes in the ratio. More precisely, they show spikes in the ratio of volumes, as the ratio, by itself, doesn’t have any volume.
On numerous occasions, we wrote that silver tends to be the metal of choice right before the local tops and before sizable price declines. The likely reason is that the silver market is dominated by individual investors that tend to be more emotional than institutions. For those, we have not been following our analyses previously – the “silver signal” is seen when silver outperforms gold on a short-, or very-short-term basis. Ideally, it should be confirmed by rather weak action in mining stocks (Friday’s action in the miners was indeed weak)
The spike in the ratio of volumes was recently the highest in months, which makes it very likely that we are at a major top or very close to one. We saw this signal a few times earlier this year and, in all cases, big price declines in gold and silver followed – if not immediately, then shortly.
A few days after the initial spike in the ratio of volumes, we saw the repeat of this signal along with a move higher in the SLV to GLD ratio itself. That was a perfect confirmation. Yet, instead of declining right after that move, we saw a move higher… And another screaming signal. The ratio of volumes was not extremely high, but the price ratio jumped dramatically. Seems like a game-changer? It’s not – we saw the same thing in mid-April and mid-June. In fact, the mid-April rally in the ratio was even sharper.
It was not a game-changer; it was in tune with what we saw recently; and it came from both: price and volume. The major sell signal.
To be honest, it’s not that surprising to see this kind of action right now. If there’s a big slide coming, then it’s not odd for the preceding sign to also be quite visible.
Speaking of the big slide, we previously emphasized how similar the current situation is to what we saw in 2013 right before the huge April downswing. Consequently, the question arises, if the current action in silver is anything like what we saw in 2013?
You bet!
The Silver-Gold 2013 Analogy
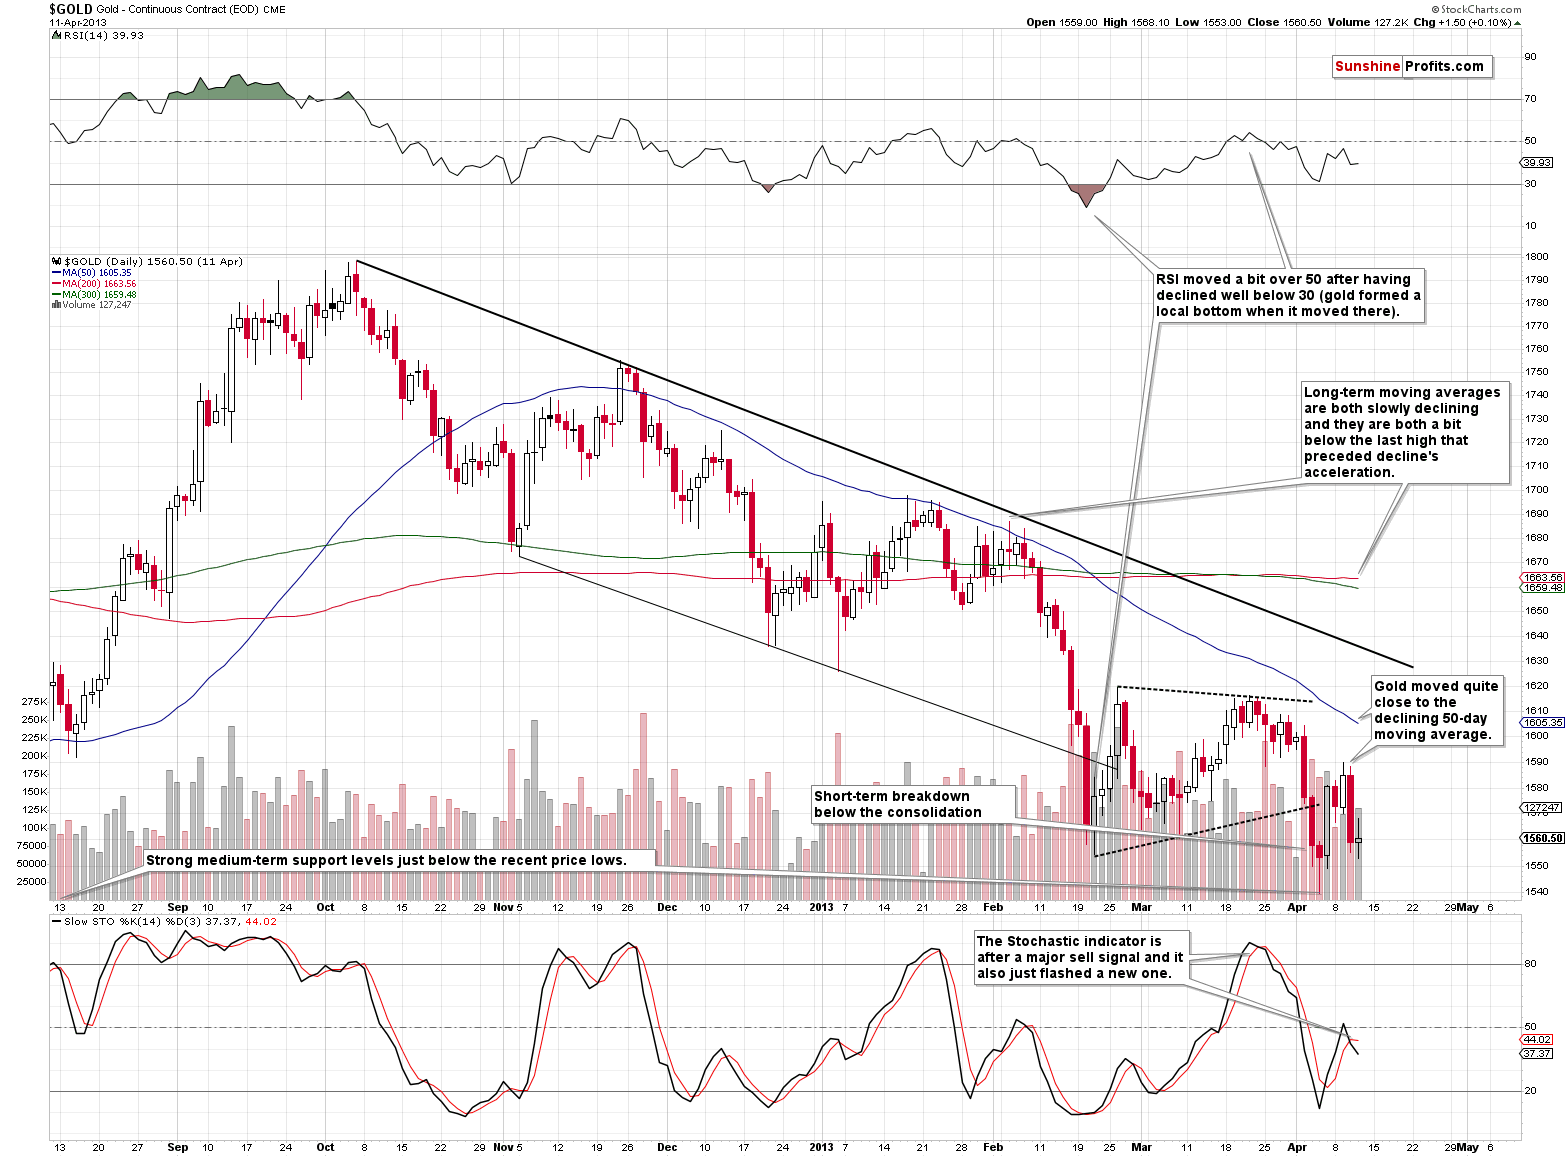
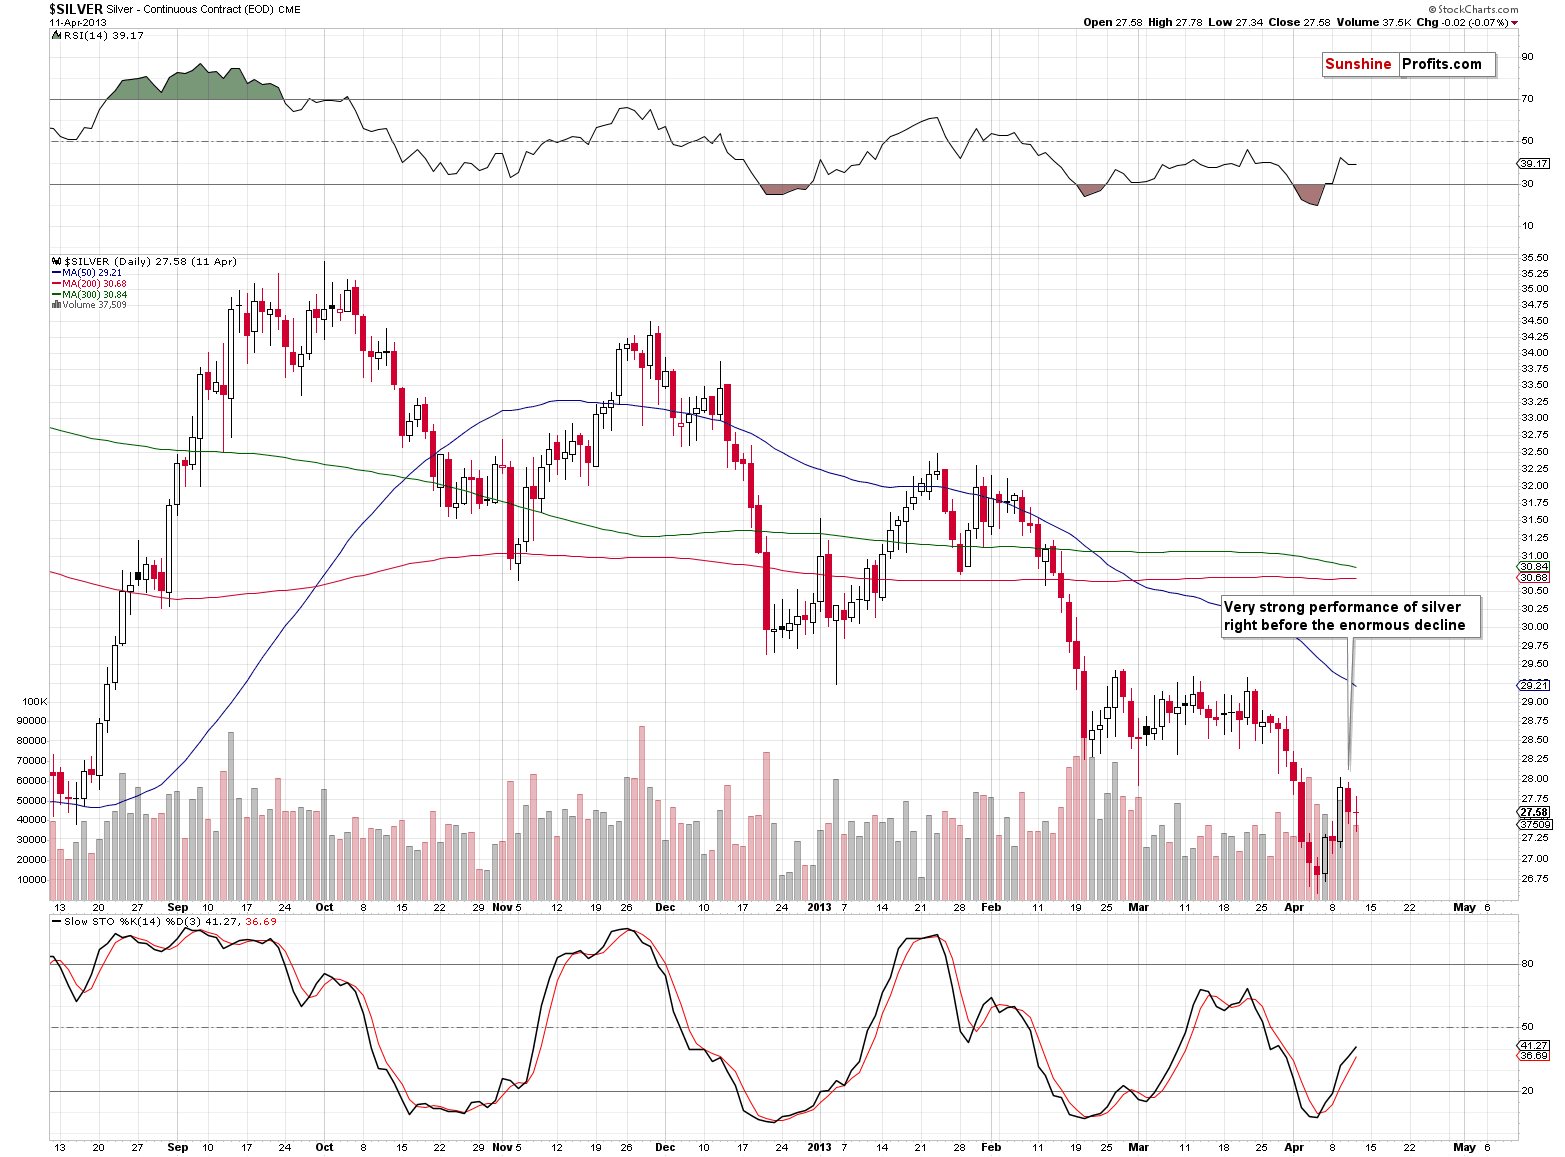
The above charts show what happened in gold and silver right before the decline. The data cutoff is just before the first day of the powerful slide. What did silver do? It outperformed and the scope of the outperformance was not minor – it was clearly visible. In particular, during the final daily rally, silver moved higher by 67 cents, while gold moved up by $11.80. Last Friday, gold rallied by $8.80, while silver moved up by exactly $0.42. The recent moves are smaller, but the starting price is also smaller. Here’s how it looks in relative terms:
In 2013, the final daily rally in gold was: 0.75%
In 2013, the final daily rally in silver was: 2.46%
This Friday, the daily rally in gold was: 0.74%
This Friday, the daily rally in silver was: 2.95%
It’s not 100% identical, but still remarkably similar.
Consequently, silver’s rally that we saw on Friday is not a bullish development, but a strong bearish sign that makes the current situation even more similar to what preceded the epic April 2013 slide.
Before summarizing, let’s take a look at what happened in platinum.
Platinum’s Breakdown
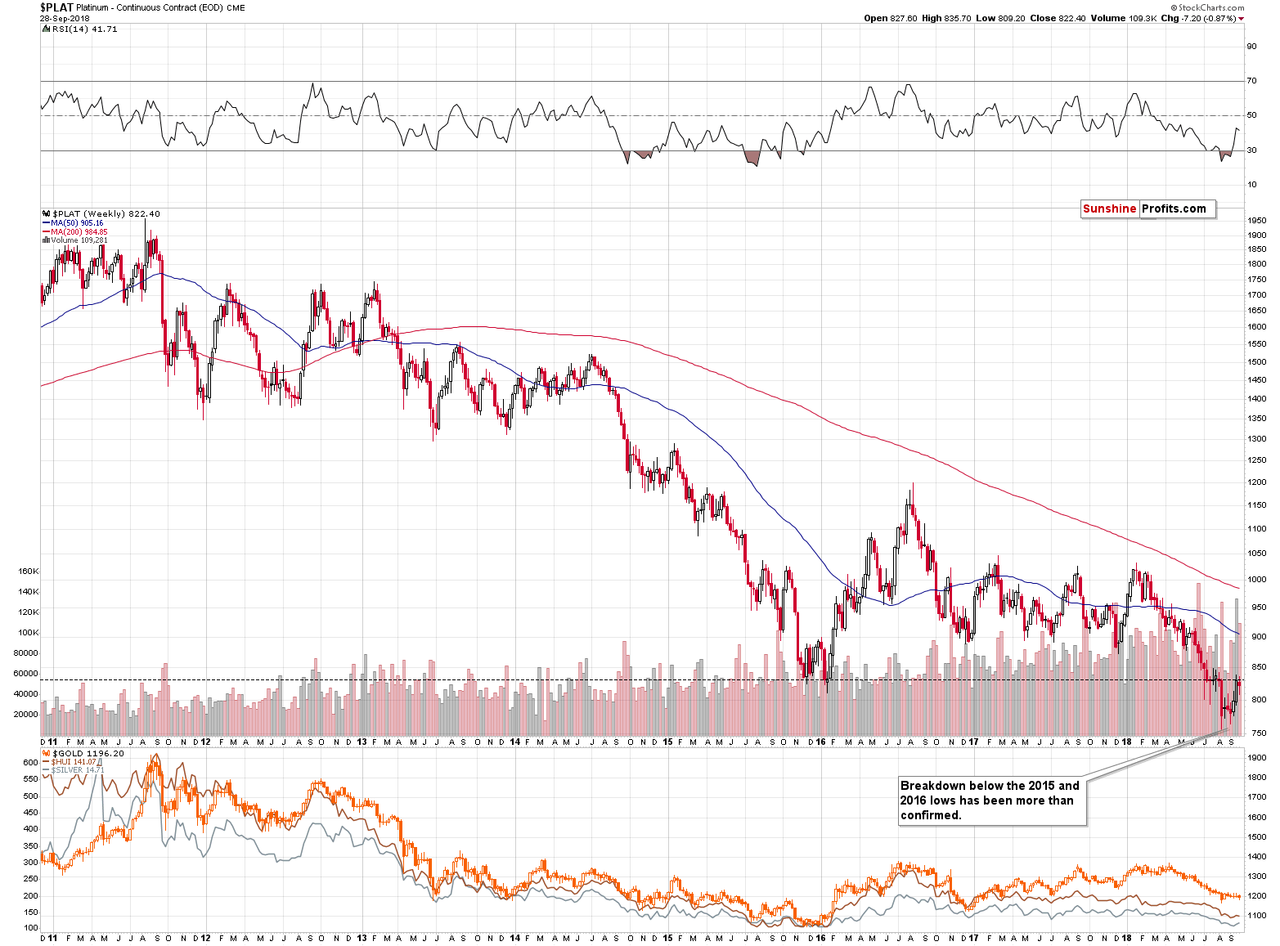
The most important detail is what didn’t happen. Based on the previous week’s closing prices, the breakdown below the 2016 bottom was not invalidated, which means that it’s very bearish implications remain in full force.
Summary
Summing up, it seems that the next big downswing in the precious metals sector is already underway. We saw the repeat of short-term outperformance, which is a bearish sign on its own, and it’s particularly bearish because of the analogy to what happened in 2013 right before the big price slide.