It’s August, it’s hot, we’re all still quasi-captives…and the collective love for stocks is getting downright steamy.
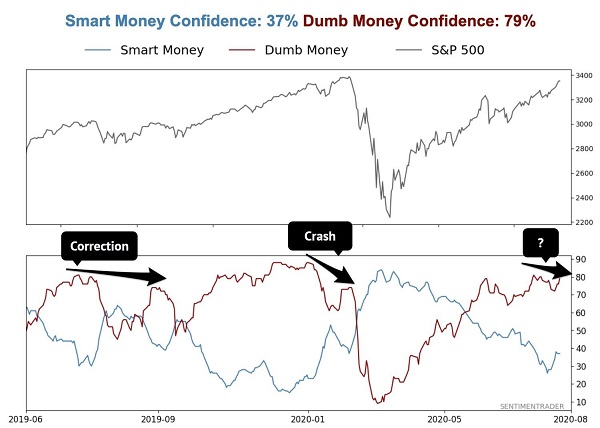
Investors have not felt this passionate about equities since January. That was, ominously, the last time the “Dumb Money” confidence level marched down from ebullient levels. Here’s a look at the “Smart/Dumb Money Confidence” chart produced by our friend Jason Goepfert at SentimenTrader (who was kind to let us republish here):

The Dumb Money is named so for a reason—it’s made up of the investors who are always late to the party. They pile in at market tops and bail at bottoms, while their “Smart Money” counterparts (fundamental-focused managers) take their lunch money.
As you can see in the chart above, an extreme level of Dumb Money Confidence (red line) is a concern because it tends to correlate to peaks in the S&P 500. This worry then becomes a bearish reality when confidence falters and these buyers turn into sellers.
Market technician extraordinaire Katie Stockton, Founder of Fairlead Strategies, prefers CNN’s Fear & Greed Index as her sentiment indicator of choice. She told me that high levels of greed aren’t the problem. It’s—once again—the march down from greed towards fear that weighs on stocks.
The CNN Fear & Greed Index today? It’s back in “Greed” territory at its highest levels since January.
How about the other surveys out there, such as the oft-quoted AAII Sentiment Survey? I don’t find them as useful as the two measures above. The AAII survey, for one, is all over the place week-to-week. That’s too volatile to give meaningful clues about sentiment.
We’ve discussed this before: emotions really only matter at the extremes. We saw extreme bullishness in January (a market top) and widespread bearishness in March (a market bottom). The sentiment levels in between were mere “noise.” Today, however, we are once again at or near an inflection point.
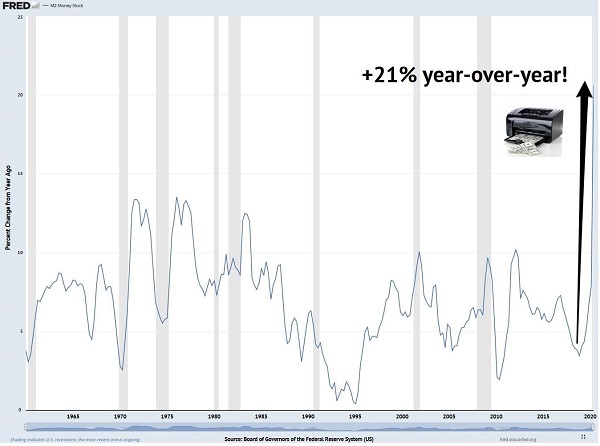
On the other hand, to give credit where credit is due, the man single-handedly floating the credit and stock markets is Fed Chair Jay Powell. He’s increased the money supply (as defined by the Fed’s own M2 metric) by a meteoric 21% year-over-year:
Our Money Supply: Up 21% Year-Over-Year

Should we respect the sentiment extremes, or dare we utter that “it may be different this time” thanks to Powell’s printer? Some of you may not care where the market goes in the interim (kudos to you for being a long-term investor!), but I know some of you do check your stock quotes every day, and that’s just how it’s always going to be. So, let’s talk about how to steady a dividend portfolio through a potential pullback.
The first is the tried and true wealth-building method of dollar cost averaging. Use the Buy list on our portfolio page (and the Best Buy list in our regular issues) to put a set amount of money to work every month. In doing so, you’ll naturally acquire fewer shares when prices are high and more when they are low.
(This works for dividend reinvestment, too. It really is the ultimate timing strategy.)
Or, to reduce near-term heartburn, you could focus your buys on low beta dividend stocks. I’m talking about firms with stock prices that swing less than the broader market.
Take, for example, a stock with a beta of 0.5. If the S&P dropped 1%, we would expect our “half-beta” holding to only drop 0.5%.
There are two ways to calculate beta:
- Check the published beta value on any financial website, or
- Use your brain and common sense and ask yourself: “How will this stock hold up if the markets meltdown?”
I suggest a combination of both approaches. While it’s easy enough to look up beta values, they are calculated from historical prices only. And as we saw in March, historical guarantees (like the fact that a 30% decline had never followed all-time highs before) don’t mean much in 2020.
Here’s what I’m talking about for a low beta stock that’s built for 2020. Its published correlation is low, and the firm is really built for manic times like these.
Ever since our first set of shelter-in-place orders in March, our home freezer has been stuffed. Overflow food goes into my office freezer. We are unrelenting in our purchase of frozen food items.
B&G Foods (NYSE:BGS), a stock I’ve made fun of in recent years for its canned and frozen food selection, is having the last laugh this year. The pantry and freezer are back in as fresh produce requires that daunting trip to the grocery store. (Even our local home-delivered produce box now has a waiting list!)
B&G’s Hot Brands of 1990, and, 2020

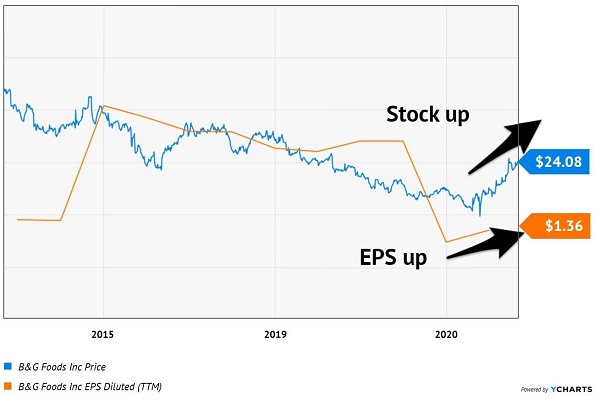
BGS has had a rough five years, but 2020 has brought the firm’s offerings back to life. Ironically, its lack of innovation positions the company perfectly for the “new normal” in which everyone hunkers down at home and “cooks” their own food. This year has been tough on most of us, but not BGS. Management has kicked back and watched its earnings-per-share (EPS) tick up for the first time in years:
Coming Back to the Eat-At-Home Trend

It’s often a bullish sign when a beaten down stock pops on modest news. BGS investors apparently just wanted the earnings leak to stop, and it’s been solidly frozen by a few bags of Green Giant peas.
The dine-at-home trend is this food maker’s friend and why these shares are more pullback-proof than the broader market. Plus, the stock pays a fat 6.5% today. What’s not to like?
That was my reasoning when I recommended BGS to a group of my premium subscribers in early June. Since then, we’ve banked a big dividend payment and we’re sitting on 24% total returns in just over two months!
That’s a pretty big run for a “low beta” stock like BGS. So, I am recommending we sit on our profits and wait for a pullback to add shares. If you don’t yet own BGS, keep it on your watch list.
Instead, I like these 7 “Hidden Yield” stocks as timely “basement beta” growth stocks to buy right now. This small, overlooked basket of recession proof stocks is not just surviving but thriving.
Disclosure: Brett Owens and Michael Foster are contrarian income investors who look for undervalued stocks/funds across the U.S. markets. Click here to learn how to profit from their strategies in the latest report, "7 Great Dividend Growth Stocks for a Secure Retirement."
