T2108 Status: 73.8%
T2107 Status: 45.4%
VIX Status: 16.3
General (Short-term) Trading Call: neutral
Active T2108 periods: Day #41 over 20%, Day #40 over 30%, Day #37 over 40%, Day #34 over 50%, Day #30 over 60%, Day #29 over 70% (overbought)
Commentary
The latest Fed play that I described in the last T2108 Update worked out pretty well. The market once again reacted with post-Fed soothing after CNN’s Fareed Zakaria hosted a discussion with the four living chairs of the U.S. Federal Reserve. ProShares Short VIX Short-Term Futures (NYSE:SVXY) gapped up, and I sold (a bit too soon granted). However, that trading action is already old news. Since that small gap up, the S&P 500 (SPDR S&P 500 (NYSE:SPY)) has logged two weak closes in a row. The index is starting to look like it is building a slippery slope with the past 7 trading days or so forming a small downtrend through the 20-day moving average (DMA).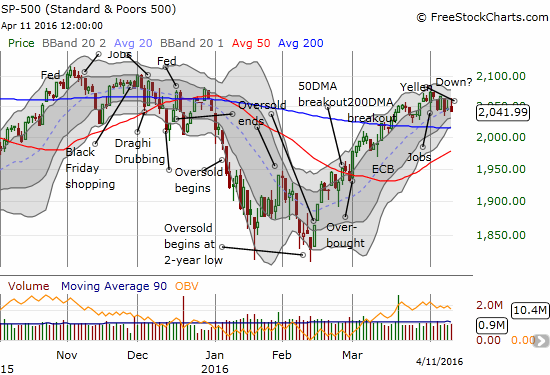
The S&P 500 (SPY) is showing a slight negative bias although support lingers directly below from the 50 and 200-day moving averages (DMAs)
T2108, the percentage of stocks trading above their respective 40-day moving averages (DMAs), closed at 73.8% as it tenuously holds onto overbought status. Monday was day #29 of the overbought period, and the S&P 500 is starting to lag expected performance. The S&P 500 is up 3.2% for the overbought period. If the overbought period ended on Monday, projections suggest around a 4-5% gain. To align with historical performance, the S&P 500 will either need to end right away, or resume in earnest its extended overbought rally.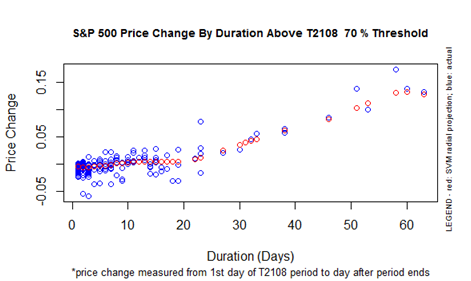
S&P 500 Performance By T2108 Duration Above the 70% Threshold
While T2108 is slipping, T2107, the percentage of stocks trading above their respective 200DMAs, remains strong. At 45.4%, T2107 has managed marginal gains the past two days and is still just below recent highs. So while some of the fastest moving stocks are losing altitude, the longer-term underpinnings of the stock market remain strong for now.
The volatility index, the CBOE Volatility Index, perked up again with an increase of 5.9% and its highest close since March 15th (by a hair). I will not get concerned until/unless the VIX shows the potential to pull away from the pivot by closing above the last intraday high.
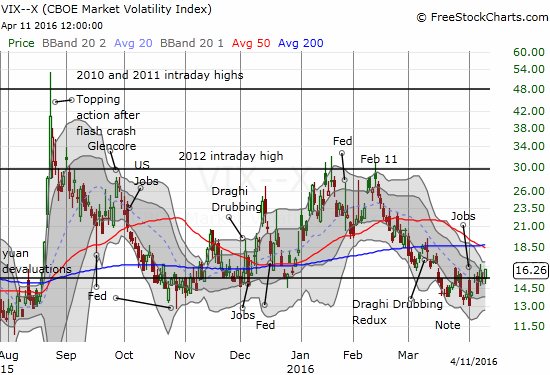
The VIX is bouncing around the 15.35 pivot but with a very slight upward bias.
Of course, an increase in the VIX ahead of earnings should not cause too much surprise.
AUD/JPY jumped on the day and essentially nullified any alarm I might have otherwise felt from the gains on the VIX.
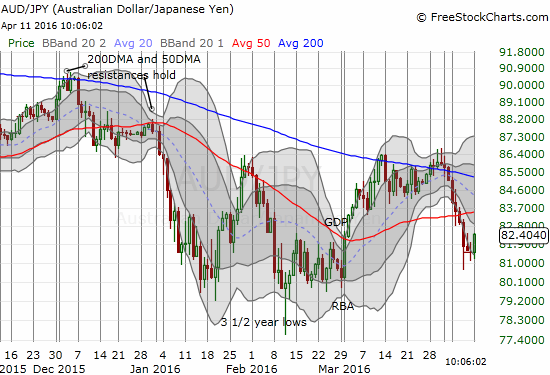
The Australian dollar versus the Japanese yen experiences a day of reprieve from its current 50 and 200DMA breakdown.
Caterpillar (NYSE:CAT) is still milling around in what looks like consolidation above its 200DMA. This position keeps CAT in a bullish 200DMA breakout. I find it hard to get bearish with CAT trading so calmly.
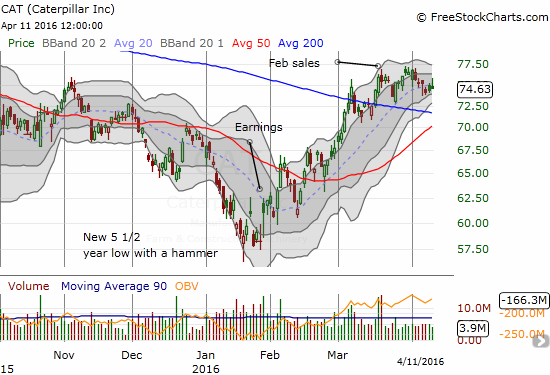
Caterpillar (CAT) is maintaining its 200DMA breakout.
Overall, my trading call remains at neutral given T2108 has the potential to make a bearish drop out of overbought conditions at any moment. Recall that such a bearish change in market character has to be confirmed by a notable drop in T2107 as well.
I am following several interesting charts for profitable trades and/or useful signals…earnings not withstanding. These charts are a telling mix of bullish and bearish signals.
The iShares Nasdaq Biotechnology (NASDAQ:IBB) immediately put to test my bullish call to buy its breakout with confidence. Since sell-offs often end after the third day, Today will be a critical test of the breakout in several ways. Note that IBB closed right at the bottom of the channel formed by the upper-Bollinger Bands (BB). Selling volume has steadily declined – a bullish sign that the selling may be coming to an imminent end.
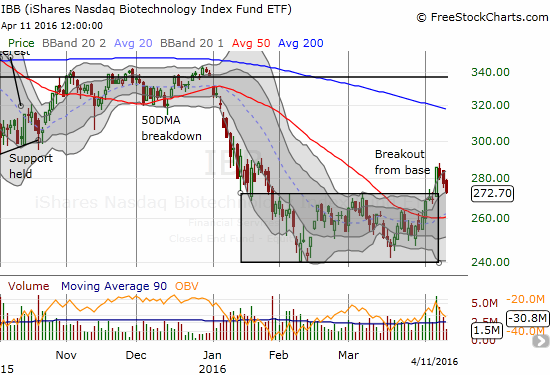
iShares Nasdaq Biotechnology (IBB) has almost reversed its breakout with three straight days of selling.
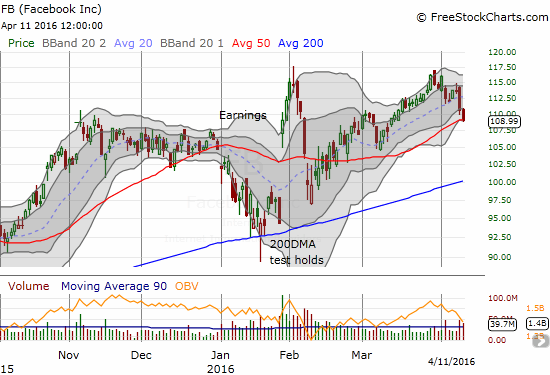
Facebook (NASDAQ:FB) faces a big test of 50DMA support. Heavy volume on the selling suggests support will not last much longer.
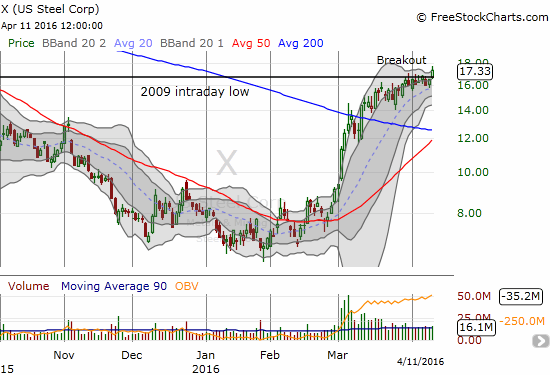
U.S. Steel finally breaks through resistance from the intraday low from 2009. Trading volume remains strong.
The rush is on into Market Vectors Gold Miners ETF (NYSE:GDX). While the chart is VERY bullish, Monday's pop is pushing GDX into an unsustainable parabolic move. While I have plenty of gold and silver plays already in hand, I am overdue to get exposure to GDX. I am buying the dips.
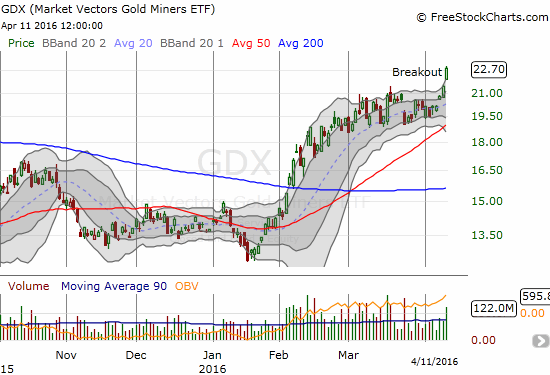
Market Vectors Gold Miners ETF (GDX) continues a major breakout. GDX was last this high January, 2015.
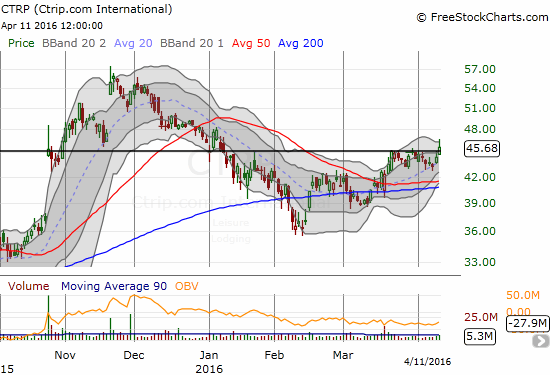
Ctripcom International Ltd (NASDAQ:CTRP) looks ready for a major breakout as it approaches its high for 2016.
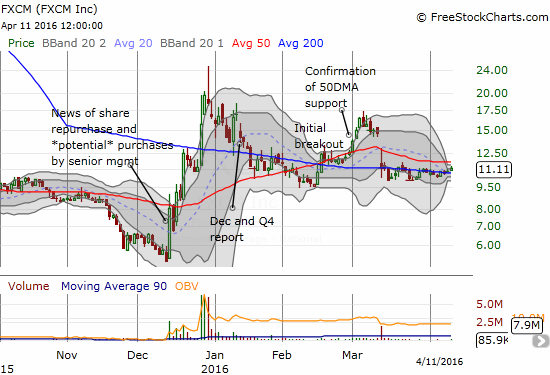
FXCM Inc (NYSE:FXCM) is in the middle of a Bollinger Band squeeze as it carefully pivots around 200DMA support and trades just below 50DMA resistance.
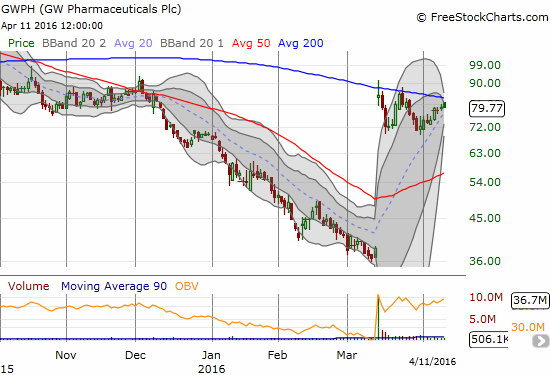
GW Pharmaceuticals Plc (NASDAQ:GWPH) has failed to follow-through on March 14th’s big gap up. The pressure is building with a THIRD test of 200DMA resistance just as a Bollinger Band (BB) squeeze builds.
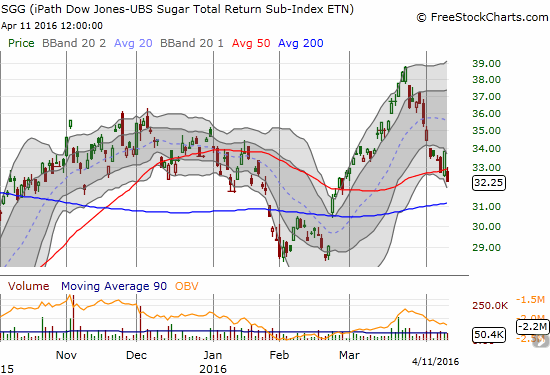
Earlier, iPath Bloomberg Sugar Subindex Total Return Exp 24 June 2038 (NYSE:SGG) as well ahead of commodities. Now it is lagging big time. 200DMA support needs to hold.
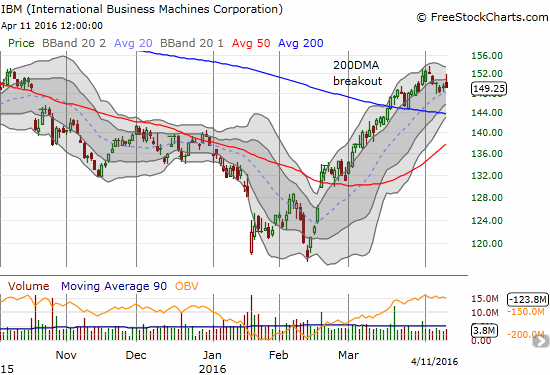
International Business Machines Corporation (NYSE:IBM) is still holding its 200DMA breakout. Maybe earnings will finally be kind to IBM this time?
Daily T2108 vs the S&P 500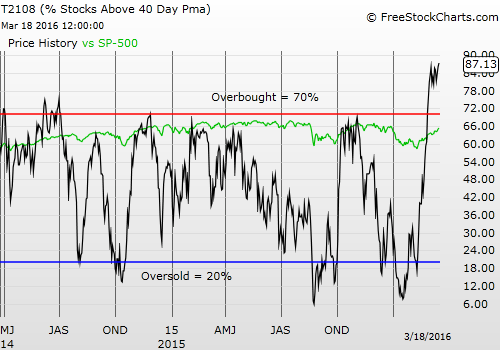
Black line: T2108 (measured on the right); Green line: S&P 500 (for comparative purposes)
Red line: T2108 Overbought (70%); Blue line: T2108 Oversold (20%)
Weekly T2108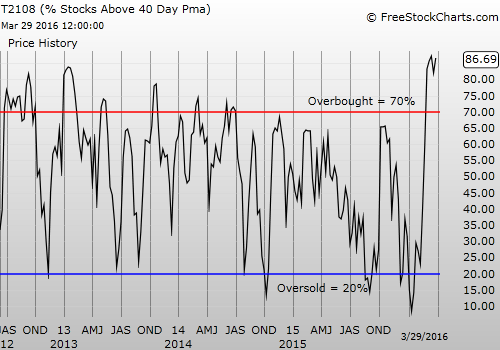
Be careful out there!
Full disclosure: short AUD/JPY, short GWPH, long GWPH calls, long FXCM, long X call options, long IBB call options, short FB
