The Dow finally reached 20K... But is the market rally running out of steam?
Not at all.
Investors are now realizing that the best has yet to come... And this week’s chart supports that idea.
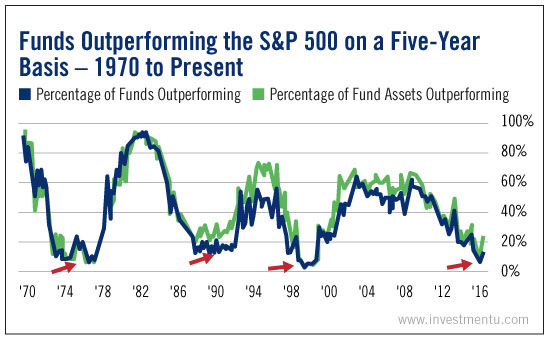
It tracks the percentage of funds (and their assets) that outperform the S&P 500 on a five-year basis.
As you can see, most funds have underperformed the S&P 500 in recent years. And in 2016, funds had an exceptionally hard time beating the market.
But each dip in the chart was followed by a significant recovery in stocks.
From early 2015 to mid-2016, the S&P 500 had virtually flatlined. But now the markets are showing signs of immense investor optimism.
According to market data from Yale’s International Center for Finance, more than 75% of investors expect the market to continue going up over the next year.
And it’s not hard to see why. This time last year, less than 23% of stocks in the S&P 500 index were trading above their 200-day moving averages.
Today, that figure is more than 65%.
Judging from both the momentum and optimism in the market today, investors should start setting their sights on Dow 30K.
But does that mean you should stuff your money into some broad market funds and call it a day? Not necessarily.
While staying diversified is important, it’s also worth digging deeper to find the sectors offering the best momentum opportunities.
For example, consider the materials and industrials sectors, which have seen wide market support behind their rallies.
Nearly 84% of stocks in the S&P 500 Industrials index are above their 200-day moving averages. And that figure is 81% for stocks in the Materials Sector index.
It should be no surprise that since President Trump’s victory in November, investors have become bullish on these two sectors.
Throughout his campaign, President Trump stated his intent to build a wall along the U.S.-Mexico border. He also discussed massive investments in our crumbling infrastructure.
And since his inauguration, he’s been on a tear, signing executive orders to turn his campaign promises into a reality.
So how can you profit from these market trends?
One option is the VanEck Vectors Steel (NYSE:SLX), which tracks the performance of companies involved in steel manufacturing and distribution. It’s up 26.3% over the last three months.
Another play to consider? PowerShares Dynamic Building & Construction (NYSE:PKB), which is up 20.9% over the last three months. It tracks the performance of construction companies that work on large-scale infrastructure projects.
Both of these ETFs and their underlying industries are sure to see big gains over the coming months.
