US indices extend gains
The sharp reversal in direction on Wall Street yesterday has extended into this morning’s Asian session, with US indices climbing between 0.05% and 0.07%. The positive sentiment extended across all bourses in the region, with the Japan225 index rising 0.48% and the HongKong33 index gaining 0.15%.
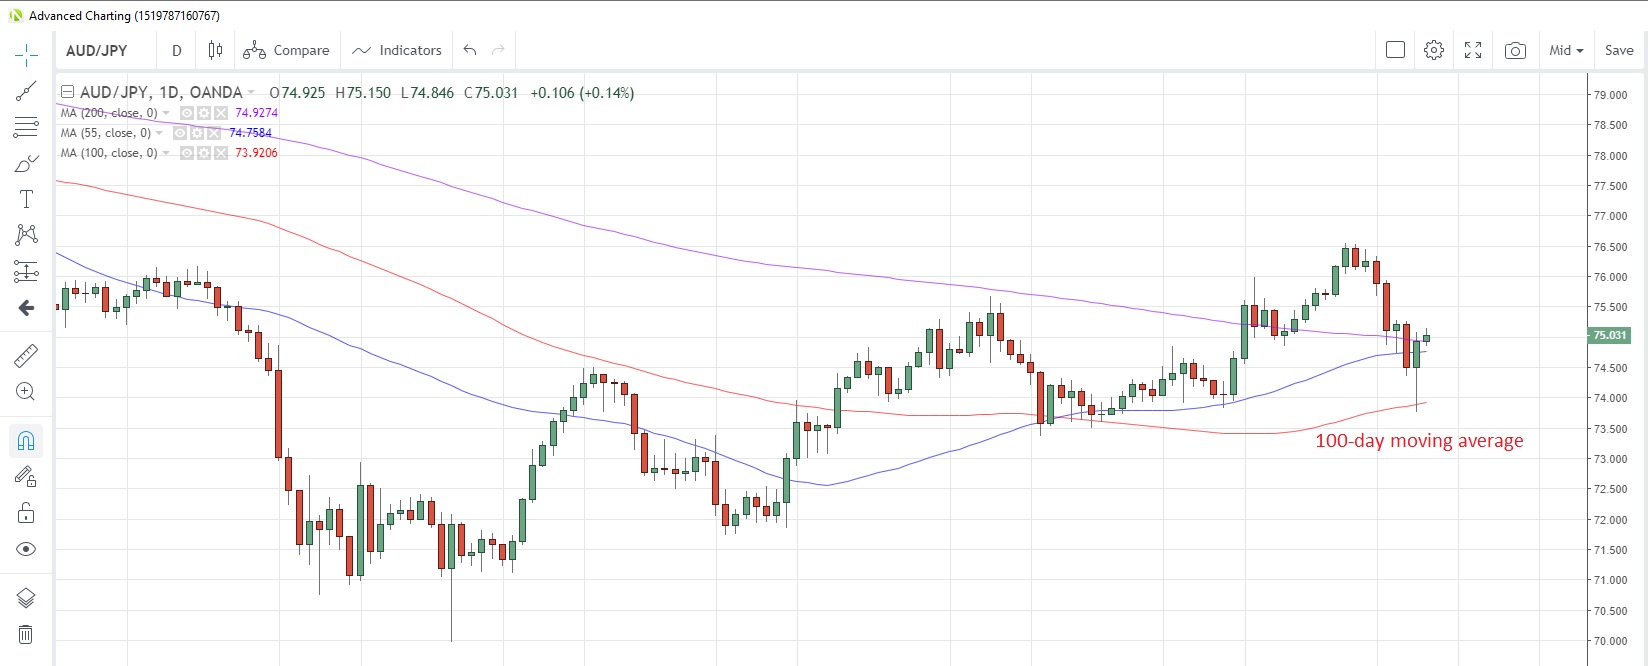
The Japanese yen continued its retreat, falling 0.07% versus the US dollar to 109.21 and 0.20% versus the Australian dollar to 75.06. AUD/JPY tested the 100-day moving average support at 73.92 yesterday, but the held on a closing basis. The pair opened on the 200-day moving average at 74.9275 this morning, and has since pushed above it.
AUD/JPY Daily Chart

China’s inflation stuck at seven-year high
Data released this morning showed China’s consumer prices rose 4.5% y/y in December, the same pace as November, which was the highest rate since January 2012. The main culprit for the stubbornly high prices was a 97% jump in pork prices in the month, a crisis which came about due to swine flu outbreak that decimated local herds last year. With the Lunar New Year celebrations looming, where pork is a significant dish, prices will likely remain high this month.
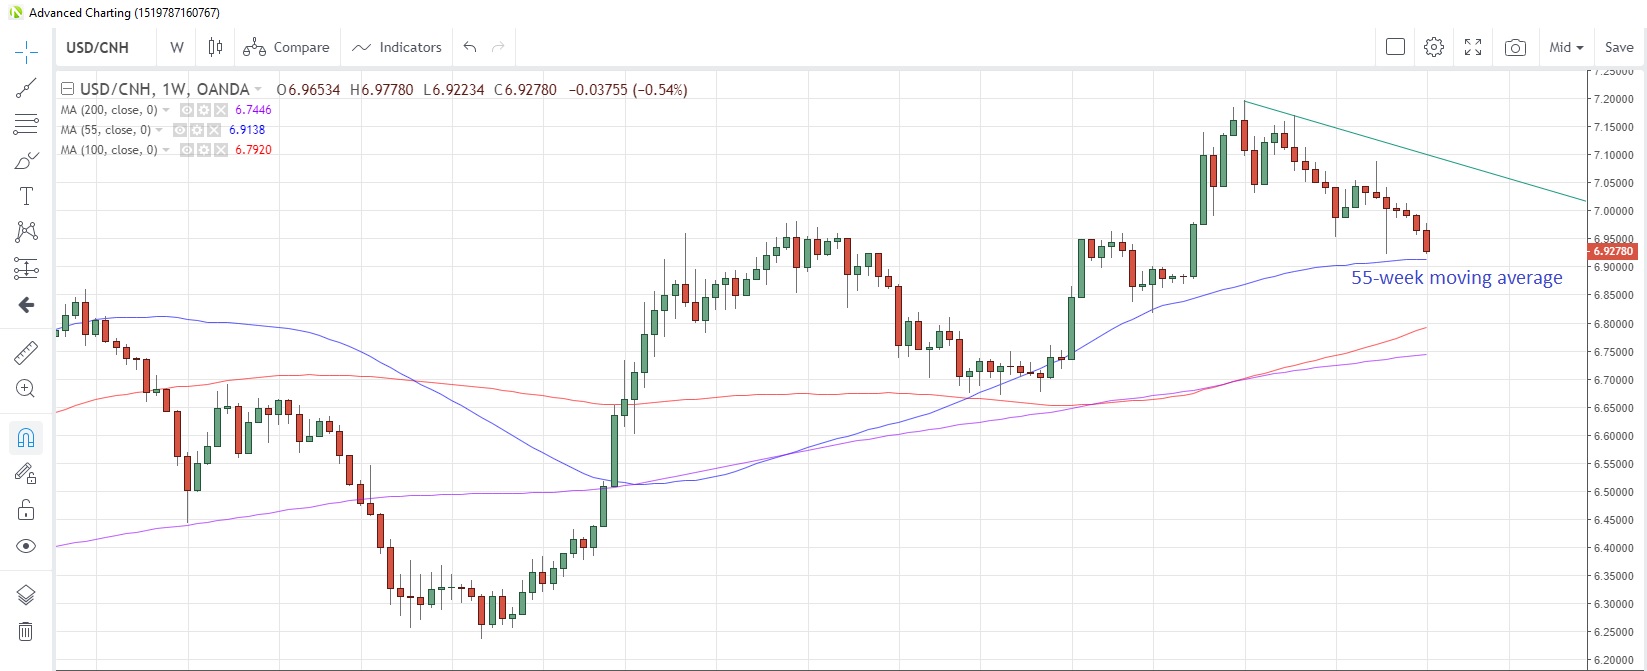
USD/CNH looks set to fall for a third straight day today as it touches the weakest level since August 1 last year amid a slightly weaker US dollar. The FX pair is heading down toward the 55-week moving average at 6.9138, which has supported prices on a closing basis since April 2019.
USD/CNH Weekly Chart

Aussie lifted by trade balance, risk rebound
The Australian dollar benefitted from the shift in risk appetite and a widening of Australia’s trade surplus in November. The balance rose to A$5.8 billion from A$4.5 billion in October, though had a slight miss versus expectations of an increase to A$5.9 billion. A 3% drop in imports was the main driver behind the surplus, with exports rising 2%.
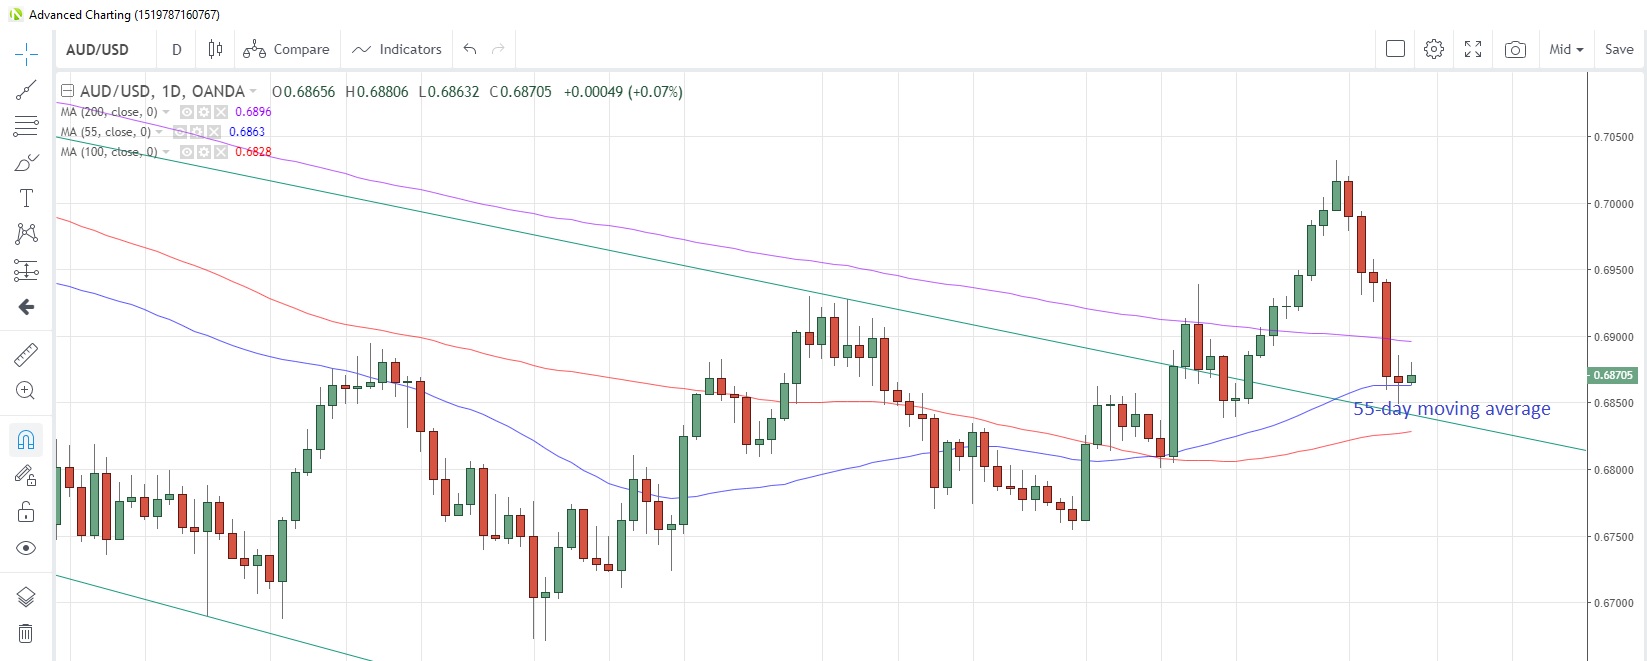
AUD/USD looks poised to break a five-day losing streak which saw the FX pair drop as much as 2.4% to the lowest level in three weeks. The pair tested the 55-day moving average at 0.6863 yesterday, but it survived the session. That moving average has supported prices on a closing basis since December 10.
AUD/USD Daily Chart

German industrial production on tap
Germany’s industrial production probably rose 0.7% m/m in November, according to the latest survey of economists. That’s a sharp turnaround from the -1.7% posted in October. The country’s trade surplus is seen shrinking to €20.0 billion from €20.6 billion as a result of a 0.5% drop in exports.
The rest of the calendar is mostly filled up with central bank speakers. Bank of England’s Carney, Fed’s Clarida, Kashkari and Williams and ECB’s Lane are all scheduled while Bank of Canada’s Poloz completes the day’s speeches.
