A recent Chart of the Day entitled “The 5% Of American Households That The Fiscal Cliff Debate Is Really About” got me thinking – is the problem “really” that the rich are taxed too little?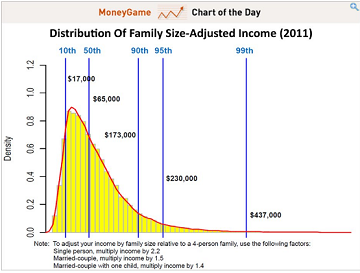
“Compare the income thresholds [that were] being debated in fiscal cliff negotiations with the actual income distribution,” said Justin Wolfers. The chart shows that at least 95% of American households will not be affected as Washington decides on whether to raise taxes on those with incomes higher than $250,000, $500,000, or $1 million. [the actual number was $400,000 / $450,000 married]
The Fiscal Cliff crisis was manufactured because of the perception that the government was spending too much while taxing too little – the deficit is growing unusually fast for peace time conditions. There is little question this is true.
The central Fiscal Cliff debate was about higher taxes on 5% of the population. A democracy requires a bell distribution of income, and the USA is not close. The USA has income inequality equal to some of the poorest and most corrupt countries in the world (CIA Factbook). Yes, income distribution is a problem.
The USA economy is out of balance. The balance was destroyed by a variety of dynamics. But income distribution does not necessarily have to be the cause of the imbalance – and very likely is only an effect of dynamics which are not in balance. When you prescribe medicine for an effect, and not the problem – the problem remains and likely will worsen. Taxing is a double edge sword, and when taken to an extreme makes most citizens equally poor – while the rich remain comparatively rich.
Is there anyone who believes a Robin Hood government can re-balance incomes?
The other side of the coin, government spending is discussed less in the open because neither political party knows how to cut entitlements (and still get re-elected). The graph below is real inflation adjusted government spending (federal and state combined) per capita. The USA does not have a current crisis on government spending – it is the future government entitlement spending which is the problem (you can read the CBO study here). And this Fiscal Cliff crisis did nothing to mitigate. This can continues to be kicked down the road.
Inflation Adjusted Per Capita Government Spending 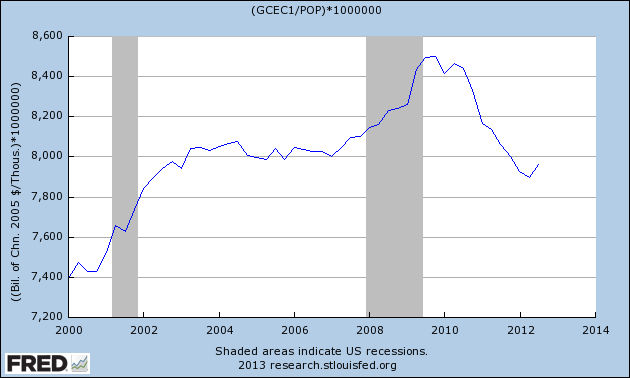
Inflation Adjusted Per Capita Government Tax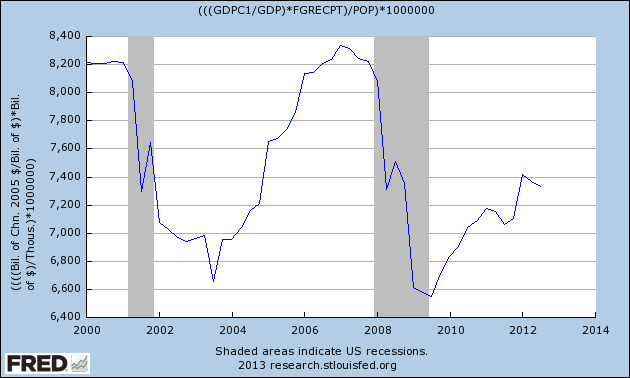
The current system in which fiscal policy operates requires control of the balance between income and spending. Economic theory requires one to believe a weak economy requires government overspending to stimulate the economy. The economy has been weak since 2000, and economic theory dictated the government should spend more than it took in – and it did, and it did – and it continues to do so. No one should be thrilled with how well this has worked out in the USA (or Japan for that matter).
The Gap Between Government Expenditures and Revenue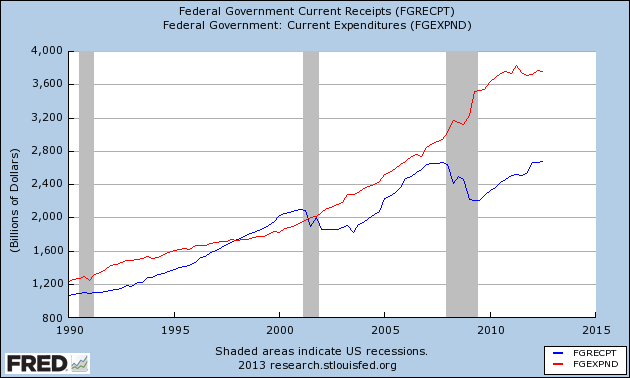
Removing money from the private sector occurs either through government spending cutbacks and /or taxation. The growing debt is building a future problem. However, the debt buildup has almost no effect in a muddle along economy – but will act as a major headwind to economic expansion.
Catch 22 – heads you lose, tails you lose. If the USA government taxes more and / or spends less – this creates a current economic headwind. If the government continues to build debt, it builds a headwind for future growth.
The real cliff the USA is facing is not addressing the cause of growing income inequality which is resulting in loss of revenue to the government. The national debate is at an elemental level targeting symptoms and not the underlying dynamics. Why are the rich getting richer?
- did trickle down economics made the rich disproportionally richer?
- did Keynesian stimulus programs since 2000 make the rich disproportionally richer?
- did consumer and environmental regulation make the rich disproportionally richer (as a small operator or mom & pop cannot enter the market)?
- did monetary policy make the rich disproportionally richer? (How does the 99% benefit from the extraordinary monetary policy measures that are directed towards capital markets and Wall Street – seems to be a “twist” on trickle down economics.)
The challenge is to energize what is left of the middle class without increasing spending levels to pay for today’s needs or increasing taxation. There are ways to stimulate the economy by relaxing regulations and rules only on the middle class.
The cliff we face is the declining middle class.
Other Economic News this Week:
The Econintersect economic forecast for January 2012 shows weak growth. The underlying dynamics have a whiff of improvement – as underlying trends seemed to have stabilized with some marginally improving. Most of the recession markers have evaporated, and one of our alternate methods to validate our forecast remains recessionary (but now only slightly so). All in all, still not a great forecast – but at least there is hope that conditions will be improving in the months to come.
ECRI believes the recession began in July 2012. ECRI first stated in September 2011 a recession was coming . The size and depth is unknown. The ECRI WLI growth index value has been weakly in positive territory for over three months. The index is indicating the economy six month from today will be slightly better than it is today. 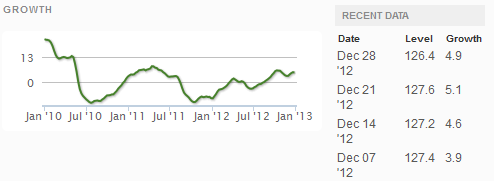
Initial unemployment claims rose from 350,000 (reported last week) to 372,000 this week. Historically, claims exceeding 400,000 per week usually occur when employment gains are less than the workforce growth, resulting in an increasing unemployment rate (background here and here).
The real gauge – the 4 week moving average – continued to fall from 356,750 (reported last week) to 360,000. Because of the noise (week-to-week movements from abnormal events AND the backward revisions to previous weeks releases), the 4-week average remains the reliable gauge.
Weekly Initial Unemployment Claims – 4 Week Average – Seasonally Adjusted – 2010 (blue line), 2011 (red line), 2012 (green line) 
Bankruptcies this Week: None
Data released this week which contained economically intuitive components (forward looking) were:
- Rail movements (where the economic intuitive components indicate a moderately expanding economy).
All other data released this week either does not have enough historical correlation to the economy to be considered intuitive, or is simply a coincident indicator to the economy.
Click here to view the scorecard table below with active hyperlinks.
