Technically Speaking For June 3-7
Summary
- There's a lot of softness in the global data. In particular, manufacturing is hurting.
- Central banks are noting the problems in the international trade arena and acting because of it.
- Despite a solid week, the rally is still suspect.
China/Japan/Asia/Australia
- Australia
- Manufacturing PMI at 51
- Retail sales decrease .1%
- GDP increases .4% in March quarter
- AIG services index increased to 52.5%
- AIG construction at 40.4
- South Korea
- Manufacturing PMI at 48.4
- Japan
- Japan Manufacturing PMI at 49.8
- Japan Service PMI 51.7
- Japan Composite PMI 50.7
- Taiwan PMI at 48.4
China/Japan/Asia/Conclusion: Trade weakness is a growing issue. Although China has implemented measures to limit the impact of the U.S. tariffs, export weakness is still emanating from China into the region. Japan is barely positive; South Korean exports are still contracting and Taiwan's manufacturing is contracting.
- Emerging Market
- Russian Manufacturing PMI at 49.8
- Russian Service PMI at 51.7
- Russian Composite PMI at 52
- Brazil industrial production decreased by 3.9% Y/Y.
- EU/UK/Canada
- EU
- EU Manufacturing PMI at 47.7
- EU Service PMI at 52.9
- EU Composite PMI at 51.8
- EU unemployment at 7.6%
- EU retail trade decreased .4%
- EU inflation at 1.2%/core at .8%
- EU GDP up .4% in 1Q; employment up .3%
- Germany manufacturing PMI at 44.3
- France manufacturing PMI at 50.6
- EU
- Canada
- Canadian trade balance decreased
- Canadian IVY PMI at 55.9
- Canadian unemployment declined .3% to 5.4%
EU/Canada conclusion: The EU, like Japan, is just this side of growth. Trade wars are really hurting EU exports, especially Germany. Canada, however, is in pretty good shape. Jobs are growing and business sentiment is positive.
US Data of Note
The Federal Reserve released the latest Beige Book (emphasis added):
Economic activity expanded at a modest pace overall from April through mid-May, a slight improvement over the previous period. Almost all Districts reported some growth, and a few saw moderate gains in activity. Manufacturing reports were generally positive, but some Districts noted signs of slowing activity and a more uncertain outlook among contacts. Residential construction and real estate both showed overall growth, but both sectors saw wide variation in sentiment across Districts. Reports on consumer spending were generally positive but tempered. Tourism activity was stronger, especially in the Southeast, but vehicle sales were lower, according to reporting Districts. Loan demand was mixed but indicated growth. Agricultural conditions remained weak overall, but a few Districts reported some improvements. The outlook for the coming months was solidly positive but modest, with little variation among reporting Districts.
The summation paragraph contains a large amount of clarifying data - sentences that, at first, report growth but then temper that statement with a negative data point. Construction increased but sentiment was varied; loan demand indicated growth, but demand was mixed. The Fed is going out of its way to point out potential areas of economic weakness.
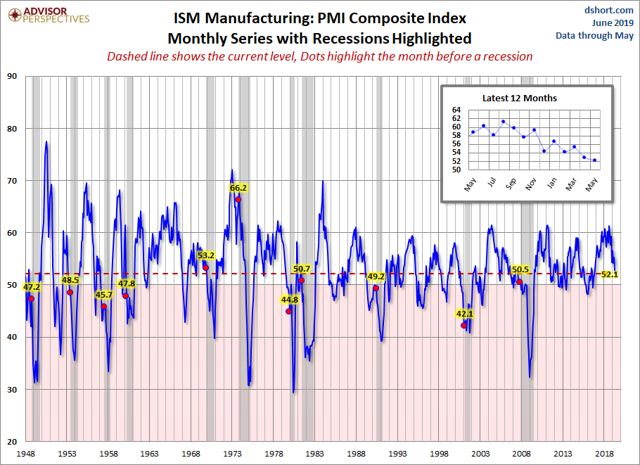
The ISM Manufacturing index was 52.1, which continues its trend lower:
From Adviser Perspectives
New orders and production are also low; the former is 52.7 while the latter is 51.3. 11 of 18 industries were expanding. Several anecdotal comments discussed trade issues (emphasis added):
- “Ongoing tariffs [issue is] impacting costs and influencing supplier realignment on country of origin. Border issue is causing delays in imports from Mexico.”
- “The threat of additional tariffs has forced a change in our supply chain strategy; we are shifting business from China to Mexico, which will not increase the number of U.S. jobs.” (Chemical Products)
- “The threat of a 15-percent increase on Section 301 tariffs is a concern. Although the potential has been around for months, the recent deadline was not expected. We had calculated and communicated the potential cost impact to our leadership.” (Petroleum & Coal Products)
The ISM Services index was 56.9, up a 1.4 from the previous months. For the last year, the headline number was in the upper 50s until five months ago, when it dropped to the mid-50s. The business activity index was a very strong 61.2 while the new orders index was a healthy 58.6. The anecdotal comments were positive, save for two discussing problems with the tariff situation and one stating that it was hard to fill employment vacancies
Friday's jobs report was a disappointment. The headline number was 75,000 with a net 75,000 downward revision for the last two months. However, the moving averages are still positive:
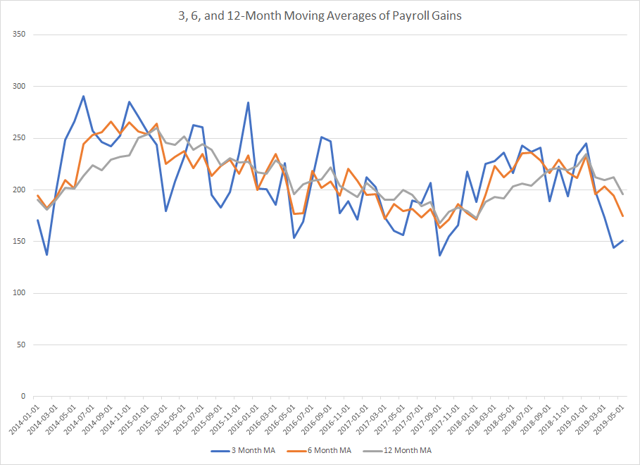
Overall, these are still pretty good numbers. Plus, we've only had a few months of weakness, so it's premature to be concerned.
US numbers conclusion: Overall, the U.S. economy is still in good shape. Services are growing at a solid pace which should help to offset manufacturing softness. While jobs data was concerning, it's only been weak for a few months. While we should keep an eye on it, there's not enough data to draw a firm conclusion.
Central Bank Actions of Note
The RBA lowered rates 25 basis points to 1.25%. They specifically noted that the trade situation is providing downside risks (emphasis added):
The outlook for the global economy remains reasonable, although the downside risks stemming from the trade disputes have increased. Growth in international trade remains weak and the increased uncertainty is affecting investment intentions in a number of countries. In China, the authorities have taken steps to support the economy, while addressing risks in the financial system. In most advanced economies, inflation remains subdued, unemployment rates are low and wages growth has picked up.
On the surface, the Australian economy is in decent shape. However, the Q/Q growth rate has been declining in the last two quarters. Business sentiment is weaker, which has led to declining investment and soft lending to small and medium-sized business. Softer business conditions combined with weak trade environment was probably spurred the RBA to cut rate.
The ECB maintained their current low rate while also stating that rates would be kept at current levels through 2020. Put another way, "for as long as necessary to ensure the continued sustained convergence of inflation to levels that are below, but close to, 2% over the medium term.". While this wasn't as bold a statement as Draghi's 2012 "Whatever it takes" moment, it does indicate a firm commitment to keeping the EU economy afloat. Here is how the ECB described the EU economy (emphasis added):
Euro area real GDP rose by 0.4%, quarter on quarter, in the first quarter of 2019, following an increase of 0.2% in the fourth quarter of 2018. However, incoming economic data and survey information point to somewhat weaker growth in the second and third quarters of this year. This reflects the ongoing weakness in international trade in an environment of prolonged global uncertainties, which are weighing, in particular, on the euro area manufacturing sector. At the same time, the euro area services and construction sectors are showing resilience and the labour market is continuing to improve. Looking ahead, the euro area expansion will continue to be supported by favourable financing conditions, the mildly expansionary euro area fiscal stance, further employment gains and rising wages, and the ongoing – albeit somewhat slower – growth in global activity.
EU manufacturing has taken the brunt of the downside problems associated with weaker international trade; German manufacturing has been especially harmed. Still, the service industry is still growing, unemployment continues to decline, and retail sales are still growing.
The Reserve Bank of India Cut rates 25 basis points. The bank was especially concerned about international developments:
Let me now turn to the key global and domestic developments that the MPC reviewed. At the outset, it noted that global economic activity has not been able to sustain the improved performance seen in the first quarter of calendar 2019 in the face of the deepening slowdown in trade and manufacturing, which has impacted advanced and emerging market economies alike. Inflation remains below target in several economies. In advanced economies, incoming data for the second quarter of 2019 point to loss of momentum relative to the first quarter. In major emerging market economies, economic activity has either slowed or has contracted. It is in this context that central banks across the world have moved to an accommodative stance in setting monetary policy. Financial markets have been unsettled by the acrimonious US-China trade tensions. Crude oil prices remained volatile, reflecting evolving demand-supply conditions and geo-political concerns. Most EME currencies have depreciated against the US dollar.
Not the heavy emphasis on international weakness, where emerging market economies where growth has either "slowed or contracted".
Central banks conclusion: The RBA, ECB, RBI, and Fed all acknowledged that trade is now a larger risk for the global economy. It was probably a contributing factor to the RBA's rate cut, and could be a reason for a future Fed action. At a minimum, all three banks this week erred on the side of downside caution.
US Markets Week in Review
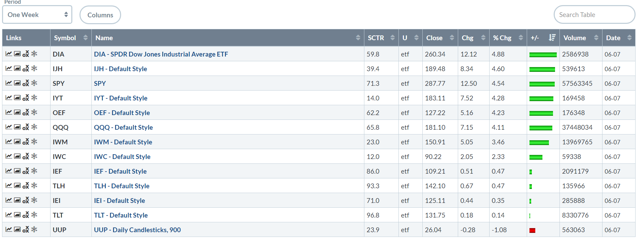
Let's start with the performance table:
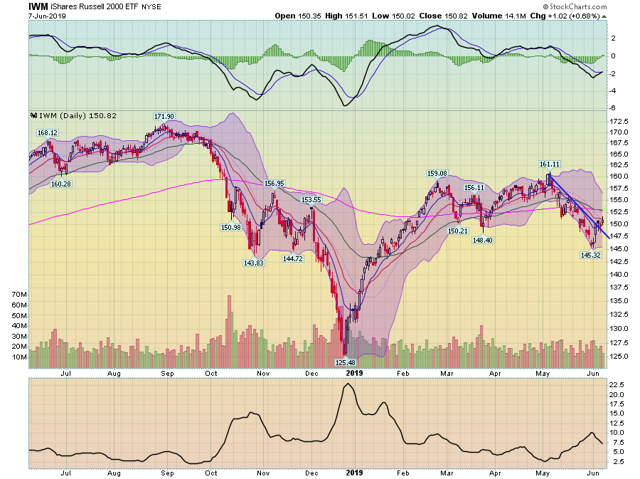
The markets needed a week like this with solid growth. But, underneath, problems remain. The large-caps rallied strongly with the DIA up nearly 5%, the SPY (NYSE:SPY) advancing 4.5%, and the QQQ rising a bit over 4%. But, as has been the case for most of the Spring rally, the small-caps underperformed. Just as concerning, the Treasury market also moved a touch higher.
Despite the good news, however, we still have the same problem we had at the start of the week.
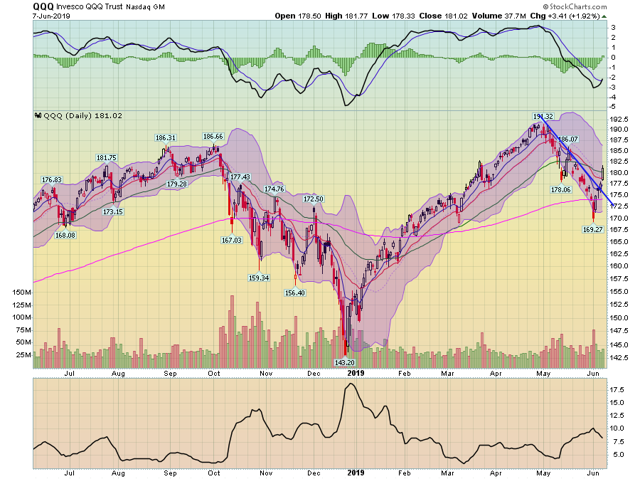
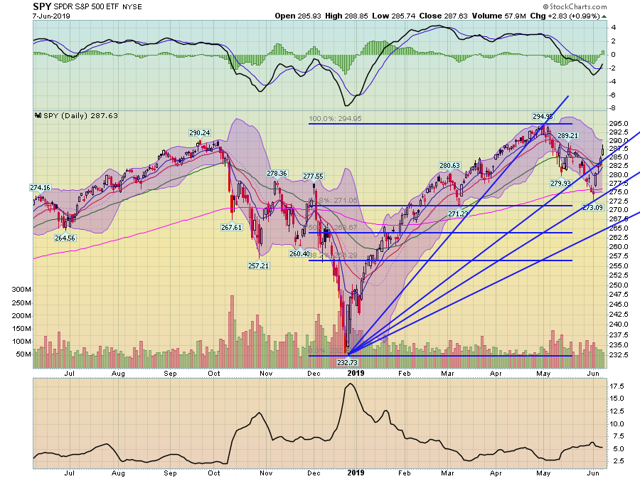
First, the good news: large-cap indexes rallied:
The QQQ broke through resistance and advanced by printing a strong bar.
The SPYs bar today was a bit weaker but it's still positive.
But, then we have the "bad news". The markets rallied today as they anticipated a weak employment report would lead to a Fed rate cut. Given that, we should have seen the small-cap indexes move strongly higher as well. But we didn't.
The IWM did break through resistance. But prices are stalled below the 20-day EMA.
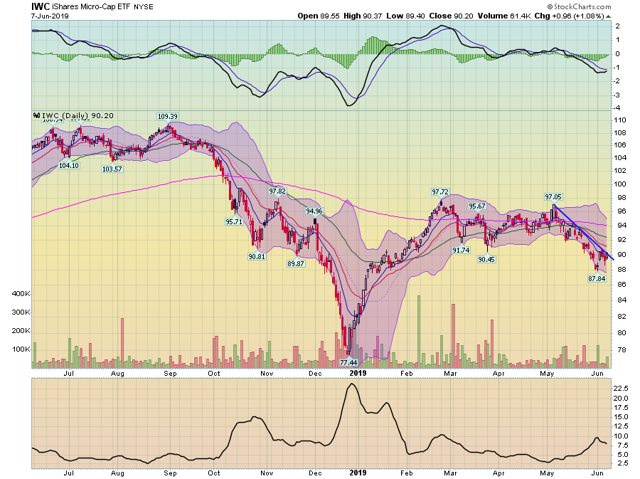
And the IWC remains below resistance.
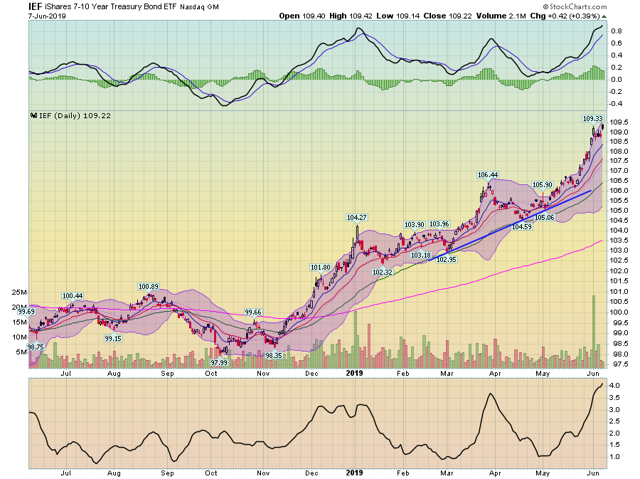
And thanks to the belief that the Fed will cut rates, the bond market rallied:
The IEF rose to a 1-year high.
And the TLT advanced just a bit; it is also near a 1-year high.
Earlier this week, I wrote what I need to see to believe in this rally:
- A selloff in the Treasury market, "at least to key levels of resistance."
- Micro-caps [and small caps] need to rally and stay above their 200-day EMA
We're not seeing that. Instead, the markets continue to behave like it's the end of the cycle:
- Large-caps are rallying because they're better able to survive a slowdown (and are more likely to pay a dividend and/or buy back shares)
- Small-caps are underperforming because they're the opposite of large-caps
- And Treasuries are rallying because traders believe the Fed is more likely to cut rates.
In other words, don't buy into the rally. At least not yet.

