Today’s stock market may not be as dangerous as 2000’s dot-com euphoria or 2008’s asset balloon. Why not? Global central banks are likely to act quicker and with far more “shock-n-awe” to minimize bearish price depreciation than they did in the previous sell-offs.
Some argue that policy efforts would fail to reinvigorate yet another wealth effect because central banks are out of ammunition. I disagree. Indeed, I expect that monetary gamesmanship in the near future will result in an average 30-year fixed rate mortgage of 2% for the 2020s. Similarly, stocks will benefit immensely from borrowing cost manipulation.
Of course, nobody knows how the current bull-bear cycle will play itself out. Might the next stock bear destroy more portfolio wealth than the previous two did? If so, commentators will likely point a collective finger at extreme leverage, colossal overvaluation and multilayered computerization.
Consider the excessive leverage being employed to own equities in 2018. For one thing, margin debt is greater than at any previous moment in history. More importantly, even when accounting for inflation and subsequently comparing margin debt to the economy itself, leveraged speculation has surged to never-before-seen heights.
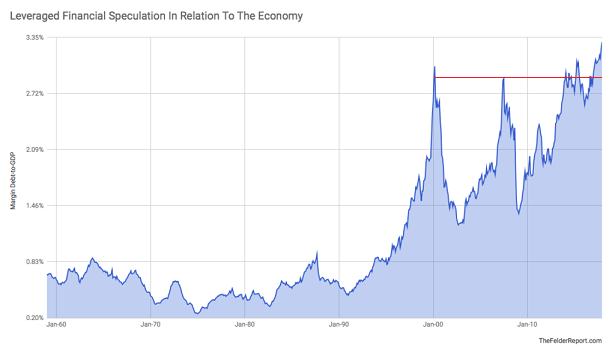
According to Jesse Felder of the Felder Report, a significant negative correlation has existed between margin debt-to-GDP and 3-year forward returns since the mid-1990s. In particular, the last two times that the ratio reached 3%, 50% stock market declines were not far behind.
On Monday, Warren Buffett chimed in on the issue. He told CNBC,
It is crazy in my view to borrow money on securities… My partner Charlie says there is only three ways a smart person can go broke: liquor, ladies and leverage. Now the truth is — the first two he just added because they started with L — it’s leverage.
Is it possible that the world’s most admired investor is fearful of what a titanic deleveraging would do to stock prices? More likely, he is worried about leverage as well as overvaluation.
In his annual letter to Berkshire shareholders, Buffett flat-out acknowledged that he has not been able to acquire assets at “sensible prices.” The Oracle of Omaha also explained that overvaluation is a major reason why he holds $116 billion in cash. (Note: Berkshire’s cash position sits near 22.5%. The percentage is the highest that it has been in the 9-year stock bull.)
Perhaps Warren Buffett still places some of his faith in market-cap-to-GDP. In 2001, he described the valuation indicator as “…the best single measure of where valuations stand at any given moment.”
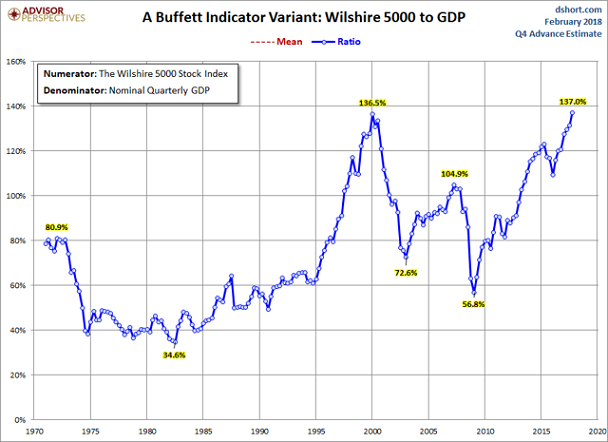
Investors can quibble with the efficacy of market-cap-to-GDP. They may find fault in a number of indicators on an individual basis. Yet they would have a more difficult time disregarding the totality of aggregate data. Indeed, regardless of the metric, stock overvaluation is either more severe than during the 2000 bubble (e.g., market-cap-to-GDP, price-to-sales, etc.) or a little less onerous than during the lead-in to 2000’s tech wreck.
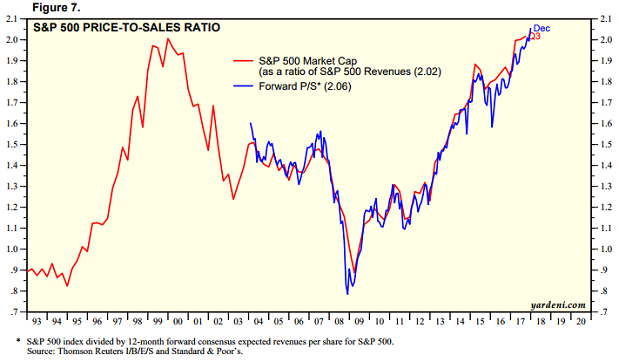
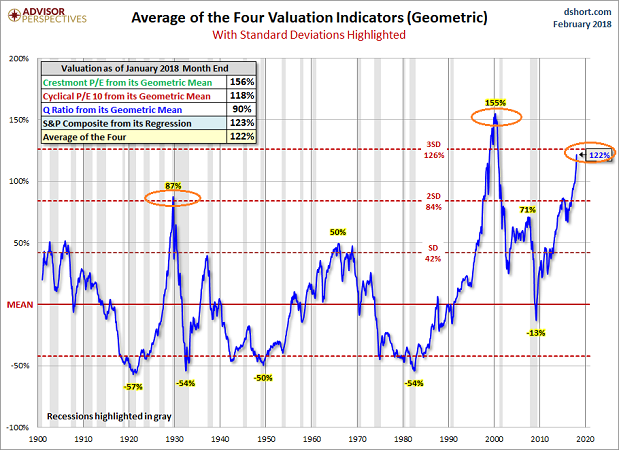
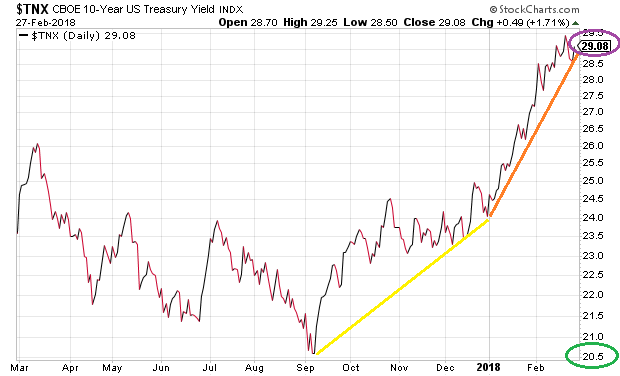
It is true that Buffett has since walked back his previous comments by serving up the low-rate justification for higher valuations. However, if lower borrowing costs justified extremely high valuations alone, you’d have to assume that those lower borrowing costs existed in perpetuity. On the contrary. We have seen how quickly an assumption about perpetually depressed borrowing costs can evaporate.
The first two reasons why the next stock bear might be more ruthless than most imagine (myself included) — leverage excesses and valuation extremes — matter because they mattered before. The third reason, the complexities of computerization, is less graspable. It is almost like sitting on a boat on a lake where a black swan lives, yet you simply have not seen the bird on the water.
Data indicate that, in 2018, a mere 10% of equity trading volume is coming from human decision-making. Where does the other 90% come from — the activity that is moving the Dow, S&P 500 and NASDAQ? It is high-frequency trading run by algorithms that buy and sell stock in microseconds.
Why might algorithmic stock trading be problematic? According to a 2015 briefing that one can find at the New York Fed’s web site, it causes market disruptions and heightened volatility. The report also opined that algorithmic trading increases the potential for systemic risk to propagate across asset classes.
Put another way, computer algorithms do not give a darn whether they’re paying a bargain price of $50 per share or a nonsensical price of $5000 per share. And they sure don’t care about those who have mortgaged their accounts to buy on margin.
In truth, the implications are more straightforward than the algorithms themselves. When computers are all buying at the same time, you get a melt-up. Nobody seems to mind when that occurs. Yet the time will come when algorithmic programs simultaneously sell. The melt-up becomes a melt-down that will not stop in modest correction-like fashion. The declines in price would eventually trigger margin calls that lead to forced liquidation of shares. At that point, neither human participants nor algorithms will be “buying the dip.” Like a snowball rolling down a mountain and picking up ferocious speed, a negative feedback loop of selling would morph into panic for human beings. The only desire will be the desire to protect capital.
The most recent corrective activity may have been an algorithmic shot across the bow – one that concerned Federal Reserve members greatly. Consider the recent trajectory of the Fed’s balance sheet. The Fed is supposedly engaging in quantitative tightening (QT) to reduce its balance sheet, not quantitative easing (QE) to increase its balance sheet. Yet more than $14 billion was added during the worst of the recent sell-off.
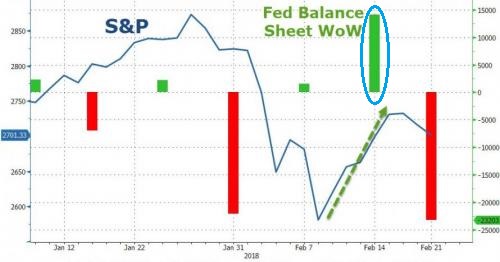
A $14.1 billion increase in the Fed’s balance sheet? Seriously? Granted, one should not expect balance sheet reduction to go in a straight line downward. Yet a week-over-week increase in that neighborhood defies logic. Indeed, monetary policy buying activity may have helped to get algorithms back on the buying track and to prevent the possibility of a wave of margin calls.
If there is good news for do-it-yourself investors, you can employ a phenomenally successful approach to managing these risks (i.e., excessive leverage, massive overvaluation, algorithmic trading). Employ the monthly close of the 10-month moving average.
There is nothing magical about the trend-following technique itself. Hedge funds and Registered Investment Advisers (myself included) use key trendlines. (So do the “algos.”) What is a little different about the monthly close is that it significantly reduces the occurrence of whipsaws, or unrewarding protection signals.
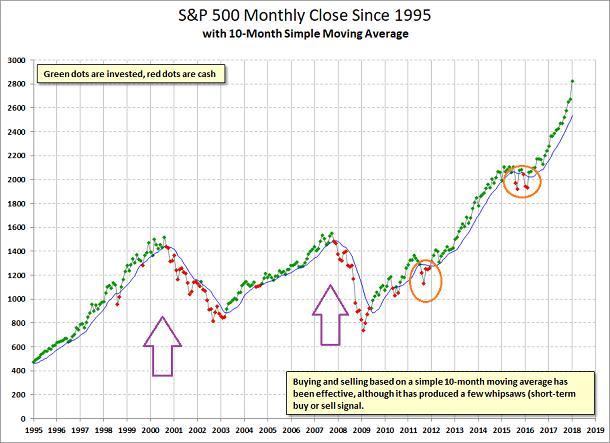
Is the monthly close on the 10-month SMA perfect? No. Has it beaten buy-n-hold with less risk (e.g., beta, standard deviation, etc.) over the last 90 years? Yes. Did it help money managers like myself sidestep the bulk of the carnage in the 2000-2002 tech wreck and the 2008-2009 financial collapse. Absolutely.
Disclosure Statement: ETF Expert is a web log (“blog”) that makes the world of ETFs easier to understand. Gary Gordon, MS, CFP is the president of Pacific Park Financial, Inc., a Registered Investment Adviser with the SEC. Gary Gordon, Pacific Park Financial, Inc., and/or its clients may hold positions in the ETFs, mutual funds, and/or any investment asset mentioned above. The commentary does not constitute individualized investment advice. The opinions offered herein are not personalized recommendations to buy, sell or hold securities. At times, issuers of exchange-traded products compensate Pacific Park Financial, Inc. or its subsidiaries for advertising at the ETF Expert website. ETF Expert content is created independently of any advertising relationship.
