Get 40% Off
👀 👁 🧿 All eyes on Biogen, up +4,56% after posting earnings. Our AI picked it in March 2024.
Which stocks will surge next?
Unlock AI-picked Stocks

The Message From Up/Down Volume

Published 09/18/2018, 01:00 PM
Updated 07/09/2023, 06:31 AM

Dot-Com Bust Bear Market

When the S&P 500 reached a bull/bear tipping point in March 2000, NYSE Advancing - Declining Volume was already waving yellow flags. As shown in the chart below, NYUD was hugging its 50-week moving average and the 50-week was rolling over in a bearish manner.
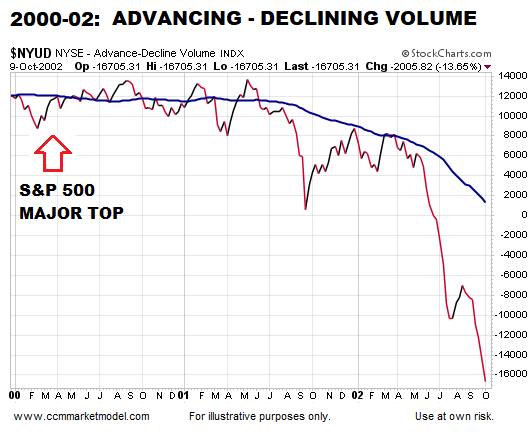
2000-02 Advancing Declining Volume

Financial Crisis Bear Market

A similar and ominous rollover look occurred in NYUD’s 50-week moving average soon after the S&P 500 peaked in October 2007. Notice how NYUD tested the 50-week and then failed by dropping below the 50-week.
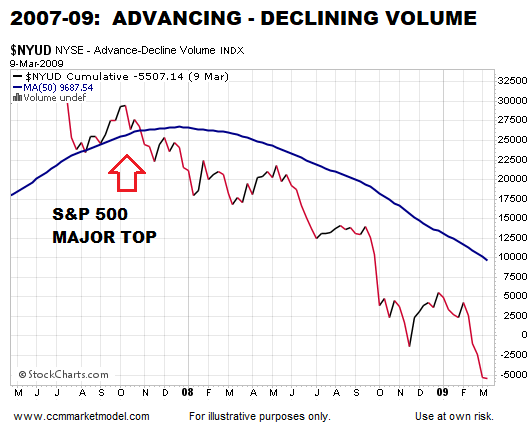
2007-09 Advancing Declining Volume

How Does The Same Char Look Today?

The 2017-18 version of the same breadth indicator looks nothing like the 2000 peak nor the 2007 peak. NYUD remains well above a positive-sloping 50-week moving average and is near new highs, indicating a much healthier market versus 2000 and 2007.
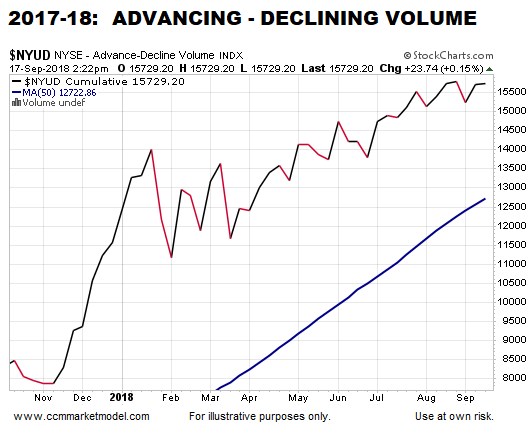
2017-18 Advancing - Declining Volume

How Does 2018 Compare To A Bullish Period?

There is no question, 2018 looks more like 1995-96 than the major stock market peaks in 2000 and 2007.
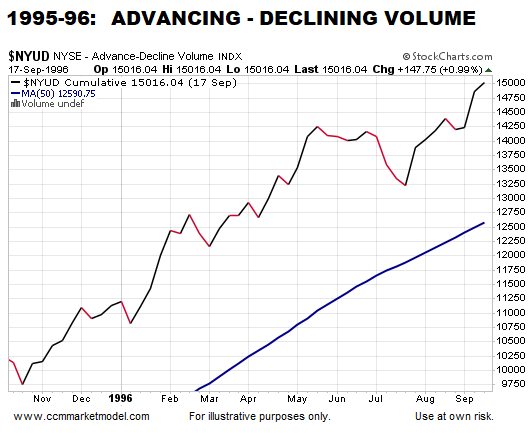
1995-96 Advancing - Declining Volume

Why It's Important To Have An Exit Strategy

This week’s stock market video covers the present-day market in the context of bear market migration strategies. Now is the time to water test your portfolio/asset allocation strategy.

Up/Down Volume Is One Piece Of Evidence

The charts above align with numerous data points that continue to favor long-term bullish outcomes for the markets and economy. If the data begins to shift in a meaningful way, we must be flexible enough to reassess the odds of good things happening relative to the odds of bad things happening.

3rd party Ad. Not an offer or recommendation by Investing.com. See disclosure here or remove ads .

Latest comments

Risk Disclosure: Trading in financial instruments and/or cryptocurrencies involves high risks including the risk of losing some, or all, of your investment amount, and may not be suitable for all investors. Prices of cryptocurrencies are extremely volatile and may be affected by external factors such as financial, regulatory or political events. Trading on margin increases the financial risks.
Before deciding to trade in financial instrument or cryptocurrencies you should be fully informed of the risks and costs associated with trading the financial markets, carefully consider your investment objectives, level of experience, and risk appetite, and seek professional advice where needed.
Fusion Media would like to remind you that the data contained in this website is not necessarily real-time nor accurate. The data and prices on the website are not necessarily provided by any market or exchange, but may be provided by market makers, and so prices may not be accurate and may differ from the actual price at any given market, meaning prices are indicative and not appropriate for trading purposes. Fusion Media and any provider of the data contained in this website will not accept liability for any loss or damage as a result of your trading, or your reliance on the information contained within this website.
It is prohibited to use, store, reproduce, display, modify, transmit or distribute the data contained in this website without the explicit prior written permission of Fusion Media and/or the data provider. All intellectual property rights are reserved by the providers and/or the exchange providing the data contained in this website.
Fusion Media may be compensated by the advertisers that appear on the website, based on your interaction with the advertisements or advertisers.
© 2007-2024 - Fusion Media Limited. All Rights Reserved.