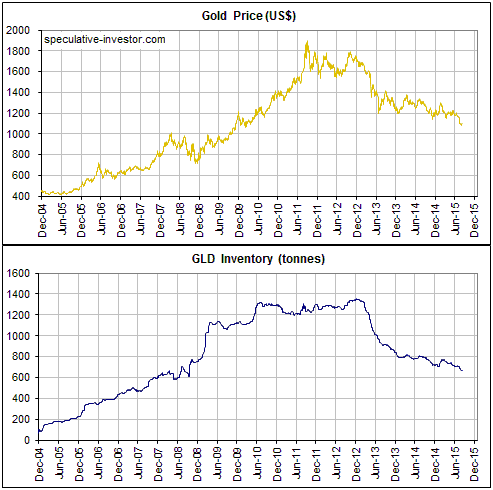
At the end of the week before last the amount of physical gold held by the SPDR Gold Trust (NYSE:GLD), the largest gold bullion ETF, fell to its lowest level since September-2008. What does this tell us?
In many TSI commentaries over the years and in a couple of posts at the TSI blog over the past year I’ve explained that changes in GLD’s bullion inventory are not directly related to the gold price. Neither a large rise nor a large fall in the gold price would necessarily require a change in GLD’s inventory, the reason being that as a fund that holds nothing other than gold bullion the net asset value (NAV) of a GLD share will naturally move by the same percentage amount as the gold price.
However, there is an indirect relationship between the gold price and GLD’s bullion inventory. At least, there has been such a relationship in the past. I am referring to the long-term correlation between the gold price and the GLD inventory that stems from changes in sentiment.
As traders in GLD shares become more optimistic about gold’s prospects they sometimes buy aggressively enough to push the market price of GLD above its NAV, which prompts an arbitrage trade by Authorised Participants (APs) involving the issuing of new GLD shares and the addition of physical gold to GLD’s inventory. And as traders in GLD shares become more pessimistic about gold’s prospects they sometimes sell aggressively enough to push the market price of GLD below its net asset value (NAV), prompting an arbitrage trade by APs involving the redemption of GLD shares and the removal of physical gold from GLD’s inventory.
That is, changes in GLD’s market price relative to its NAV create opportunities for arbitrage trades that adjust the supply of GLD shares and the amount of physical bullion held by the fund, thus ensuring that the market price never deviates far from the NAV. This modus operandi is common to all ETFs.
Since traders in GLD shares tend to become more optimistic in reaction to a rising price and less optimistic in reaction to a falling price, the most aggressive buying of GLD shares will tend to occur after the gold price has been trending higher for a while and the most aggressive selling of GLD shares will tend to occur after the gold price has been trending lower for a while. This explains why the following chart shows that the long-term correlation between the gold price and the GLD inventory is strongly positive and why the major downward trend in GLD’s inventory began well after the 2011 peak in the gold price.
The upshot is that the price trend is the cause and the GLD inventory is the effect.

In conclusion, here are three implications of the above:
1) Anyone who claims that the gold price has trended lower over the past few years due to the selling of gold from GLD’s inventory is getting cause and effect mixed up.
2) Anyone who claims that gold is being removed from GLD’s inventory to satisfy demand in Asia (or elsewhere) is either clueless about how ETFs work or is telling untruths to promote an agenda.
3) The early August decline in GLD’s bullion inventory to a new multi-year low was consistent with the price action. It was evidence that GLD traders were getting increasingly bearish in reaction to lower prices. They loved it at $1600-$1900 and they hated it below $1100.
