
The Hartford Financial Services Group, Inc. (NYSE:HIG) reported second-quarter 2016 operating earnings of 31 cents per share, which missed the Zacks Consensus Estimate by roughly 60% and also plunged 66% year over year.
The underperformance stemmed due to the weakness in Personal Lines automobile and P&C Other Operations along with shut down of asbestos and poor performance of environmental (A&E) lines. However, underlying margins remained strong in Commercial Lines and Group Benefits.
Including extraordinary items, The Hartford reported net income of 54 cents per share, down 44% year over year.
Total revenue of The Hartford came in at $4.7 billion, down 0.17% year over year. The downside can be attributed mainly to lower premiums earned, fee income and less net investment income.
Segment Results
Property & Casualty (P&C): This segment’s core earnings were $15 million, down 92% from $193 million in the year-ago quarter. The P&C segment reported net income of $33 million in the second quarter, down 82% from $189 million in the prior-year period.
After tax, P&C underwriting losses were wider by $159 million from the year-ago quarter largely due to higher unfavorable PYD for the Personal Lines automobile. Shut down of asbestos and poor performance of environmental (A&E) lines, higher catastrophe losses and lower current accident year also contributed significantly to this loss.
P&C written premiums inched up 1.4% from the year-ago quarter to $2.6 billion on the back of growth in Commercial Lines and Personal Lines.
Investment income of $226 million decreased 5.4% year over year, while other revenues improved 15% from the year-ago quarter to $23 million.
Group Benefits: This segment of The Hartford generated core earnings of $46 million, down 19% year over year. The decline was attributable to lower net investment income and increased losses, partially offset by decreased expenses. Net income came in at $55 million, down 1.8% from $56 million in the prior-year quarter.
Group Benefits’ fully-insured ongoing premiums inched up 1% to $790 million. Loss ratio deteriorated 90 basis points year over year to 78.5% owing to the rise in group life loss ratio.
Mutual Funds: Core earnings at The Hartford’s Mutual Funds segment were $20 million, down 9.1% year over year. This was due to a decline in fees on account of lower average Assets Under Management (AUM) than the prior-year quarter. Net income in the quarter declined 9.1% year over year to $20 million. As of Jun 30, 2016, total AUM came in at $90.9 billion compared with $95.8 billion at the end of second-quarter 2015, primarily due to the steady runoff of Talcott AUM. The net flows of Mutual Fund decreased mainly due to higher redemption.
Talcott Resolution: Core earnings at Talcott Resolution plummeted 47% year over year to $91 million. The deterioration is attributable to the lesser fee income due to the continued runoff of the annuity business. The segment’s net income of $104 million saw a sharp decline of 52% from the year-ago income of $217 million.
Corporate: The Hartford’s Corporate segment recorded core loss of $50 million, slightly narrower than the year-ago quarter loss of $53 million. Also, the segment recorded net income of $4 million. It has incurred a loss of $71 million in the year-ago quarter.
Financial Update
Net investment income of The Hartford declined around 7.7% year over year to $735 million in the reported quarter. This was largely due to a decrease in lower limited partnership.
The Hartford’s shareholder equity came in at $18.6 billion as of Jun 30, 2016, up 5.2% from $17.6 billion as of Dec 31, 2015.
Book value per share increased roughly 10% to $47.02 from $42.86 as of Dec 31, 2015. Excluding AOCI, The Hartford’s book value per share came in at $44.74 as of Jun 30, 2016, up 5.5% from $42.41 as of Dec 31, 2015.
Dividend and Securities Update
The Hartford spent $350 million for share repurchases and $82 million for dividend payment during the second quarter.
HARTFORD FIN SV Price, Consensus and EPS Surprise
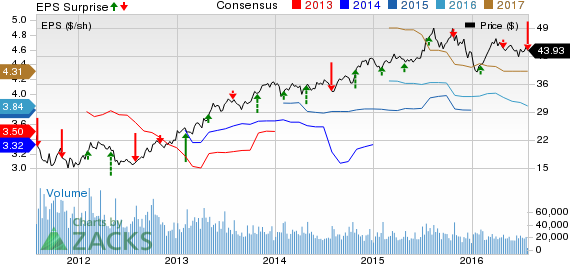
HARTFORD FIN SV Price, Consensus and EPS Surprise | HARTFORD FIN SV Quote
Zacks Rank and Performance of Other Insurers
Hartford Financial presently carries an unfavorable Zacks Rank #4 (Sell).
Among other property and casualty insurers that have reported their second-quarter earnings so far, the bottom line at RLI Corp. (NYSE:RLI) and Progressive Corp. (NYSE:PGR) missed their respective Zacks Consensus Estimates, while First American Financial Corporation’s (NYSE:FAF) earnings beat the same.
HARTFORD FIN SV (HIG): Free Stock Analysis Report
RLI CORP (RLI): Free Stock Analysis Report
PROGRESSIVE COR (PGR): Free Stock Analysis Report
FIRST AMER FINL (FAF): Free Stock Analysis Report
Original post
Zacks Investment Research