A very interesting last 30 days...let’s look at the weekly and daily charts on the almighty buck. Let me get this straight -- the greenback rallied on speculation that a rate hike may happen sooner rather than later; higher rates should equate to a stronger dollar. On Wednesday, Bernanke set the market straight, verbalizing that not so quick should we bake in a rate increase. The dollar is an integral part of many trading decisions when I decide what commodities to trade, in what direction and even scaling on position size.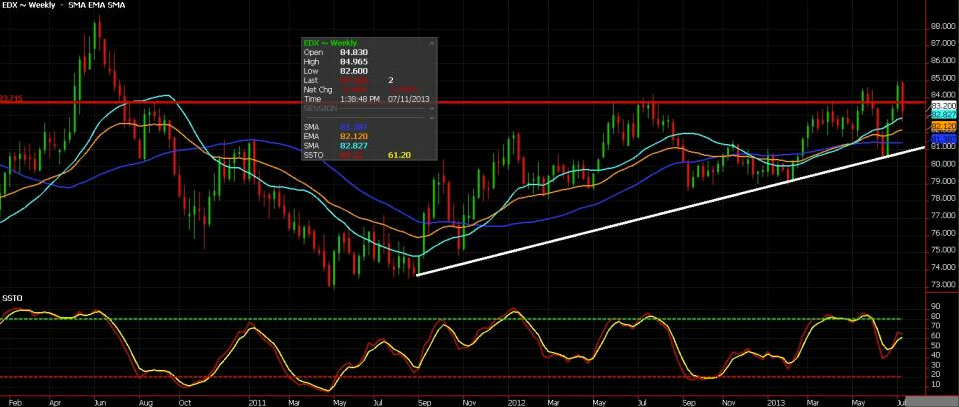
Take Away:
- A potential double top the last two weeks
- Is a bearish engulfing candle in the making?
- Will we close under the 20-day MA (light blue line)?
- To see any significant depreciation prices will need to penetrate the up sloping trend line that comes in just below 81.00…white trend line held since summer of 2011.
Take Away:
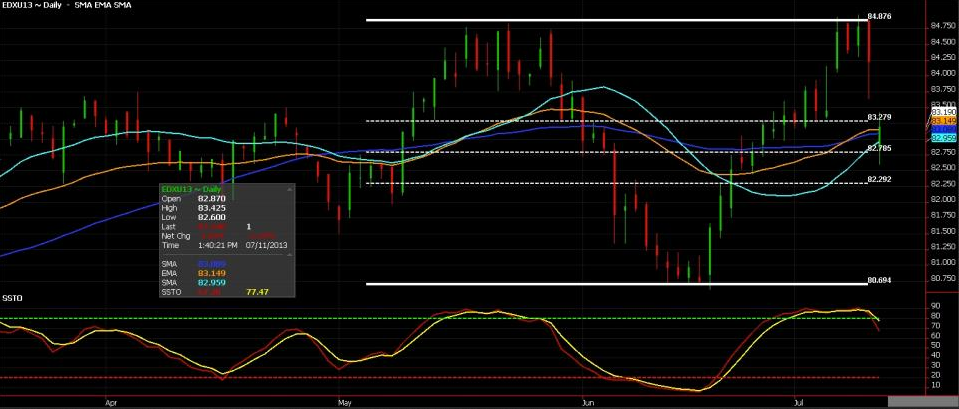
- Stochastics have started to roll over
- A gap lower open on Bernanke comments yesterday...perhaps an overreaction?
- Observe the 38.2, 50 & 61.8% Fibonacci levels.
- In May/June prices depreciated 4.4% only to turn around in June/July and appreciate 5.25%.
- A settlement below the 20-day MA (light blue line) puts the control back to the bears in my eyes.