‘Twas a year ago at this time we opted out of forecasting a high price for Gold in 2023, other than to opine ‘twould make a new All-Time High (above that of 2089 from 07 August 2020), which indeed eventuated at 2152 this past 04 December. Since then, XAU/USD proceeded to settle the year yesterday (Friday) at 2072.
Opting to not forecast a high for 2023 was simply a function of “Who knows how high ‘twould go” once the then existing 2089 All-Time High was eclipsed. To wit, you may recall our tongue-in-cheekily leaving such prognostication to the “Fibonacci Extension Crowd”.
So how is it any different this time for 2024, MMB?
Well, dear Squire, we’ve drawn upon our response to that which you herein queried a week ago. For this time ’round we’ve at least some historical guidance upon which to draw. To cut to the quick: we demonstrated last week that century-to-date whenever Gold has had a five-day run into Christmas of better than +1.0%, its average maximum price increase (as measured from the settle of the last trading day before Christmas) through the ensuing year is +23.9%. That average comes from seven qualifying occurrences from 2001 through 2022: and now for 2023 we’ve an eighth occurrence. Thus applying that +23.9% average maximum increase to Gold’s 2065 settle this past 22 December would bring 2557 during 2024.
However: because a) we fully comprehend that “average” is not “reality” and more importantly that b) cash management drives at least some degree of capital preservation (which for you WestPalmBeachers down there otherwise means “greed kills”), we’ve decided to lop off one standard deviation of that average, which then conservatively forecasts +15.0% above 2065 — thus 2375 — for 2024’s high. Anything beyond that is gravy. Thus from the “Sneak Preview Dept.” the above Gold Scoreboard now highlights next year’s high forecast, which upon being achieved shall be a beautiful thing.
Beautiful too is Gold’s having completed 2023 +13.2% to stand on the BEGOS Markets’ podium, second only to the S&P 500 +24.2%. (We’re considering from time to time re-christening the latter as the “Casino 500”, for clearly as this Investing Age of Stoopid continues to unfold, any consideration of earnings for price valuation has been summarily dismissed; more on that catastrophic catalyst later). But for the present, here are the Final BEGOS Markets Standings for 2023:

Save for the S&P, the most glaring out-of-sorts pairing therein is Gold’s firm performance versus Silver’s no performance (-0.6%). At year-end 2022, the Gold/Silver ratio was 75.7x; here at year-end 2023 it is 86.2x. The century-to-date average is now 67.9x, at which ratio (given Gold’s present 2072 level) means Silver instead of being 24.03 today would find it +21% higher at 30.50. So again for those of you scoring at home: do not forget the Silver! As for cellar dweller Oil (-11.4% in settling the year at 71.33): the percentage price of one barrel of “Black Gold” per one ounce of Gold is a wee 3.4%, the average this century being 6.8%. “Green” may be popularly great, but do not Oil underestimate it.
Specific to our Gold, here are its weekly bars across the entirety of 2023, the present parabolic Long trend is now 11 blue dots in duration. And in pointing toward more in 2024, we anticipate Golden fireworks galore:

Next we broaden the Gold perspective by bringing up the yellow metal’s year-over-year cumulative percentage track along with those of key precious metals’ equity brethren. Thus as measured from 28 December 2022 through 29 December 2023, we again have Gold itself leading the pack +14%, and then in descending turn: the VanEck Vectors Gold Miners exchange-traded fund (GDX (NYSE:GDX)) +8%, Agnico Eagle Mines (AEM) +5%, the Global X Silver Miners exchange-traded fund (SIL) -1%, Pan American Silver (PAAS) -2%, Newmont (NEM) -13%, and finally Franco-Nevada (FNV) -19%. So the bottom line here remains the ever-lagging nature of the equities:

As to how ’tis all really going comes the StateSide Economic Barometer. What we’ve gleaned from the FinMedia is, should you be seated on the left side of the aisle, the economy is doing fantastic; if instead on the right side, ’tis at best spastic. But because we do the math, the Econ Baro’s net negative bent appears rather drastic. Indeed, here’s a stat with which you shan’t be provided anywhere else: of the 590 incoming metrics for the Baro during 2023, 47% improved from period-to-period, 47% worsened, and 6% were static. (Per the performance by the prognosticators: 17% of the metrics met consensus estimates, 43% were better, and 40% were worse).
“So why then the ‘net negative bent’ as you put it, MMB?
Because, Squire, 30% of all period-to-period readings were then revised lower, whereas only 25% were revised higher, (leaving 45% unrevised). All-in-all, hardly fantastic, rather more spastic, and bent toward drastic:
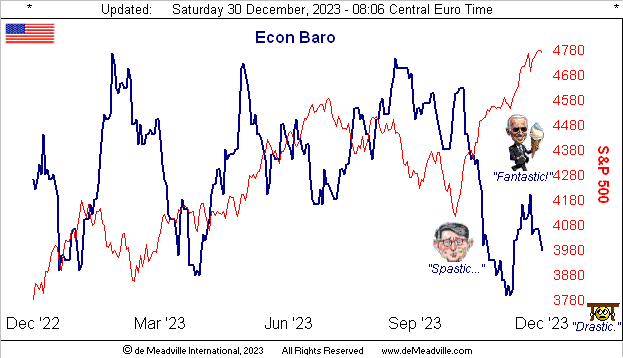
Course, the red line accompanying the Baro is the afore-dubbed “Casino 500” (has a rather realistic ring, non?) The Big Roulette wheel through year-end is now 37 consecutive trading days “textbook overbought”, placing it in the 97th percentile of all such overbought conditions across the past 44 years. As for the aforementioned dismissal of earnings, our “live” price/earnings ratio finished the year at 46.3x: that is +82% above our first such reading of 25.4x in January 2013. Similarly from that same month, Bob Shiller’s CAPE has leapt +46% from 22.1x to now 32.3x, and the otherwise “broker-parroted” S&P/DJI version has expanded +53% from 17.3x to now 26.4x. The annualized all-risk “Casino 500” yield settled the year at 1.466%, the annualized no-risk U.S. three-month dough is at 5.180%. Or in quoting Roger Moore to Gloria Hendry: “Make your choice.” –[Live and Let Die, ’73]
Still, if living by the website’s Market Trends page, ’tis been hard to be wrong of late given the dying Dollar, the Buck having dumped -6.2% of its Index value high-to-low in the year’s final two months. Why, the Swiss Franc alone now costs more than $1.20 for the first time (save for its €uro-decoupling one-day spike on 15 January 2015) since 06 September 2011, (that date ringing a bell as ’twas Gold’s 1923 All-Time High which never again was breached until the noted 07 August 2020 date). But to the point: with the exception of Silver (sadly), the BEGOS Markets’ grey regression trendlines across the past 21 trading days are all in positive slant, the baby blue dots indicative of the consistency of those trends:

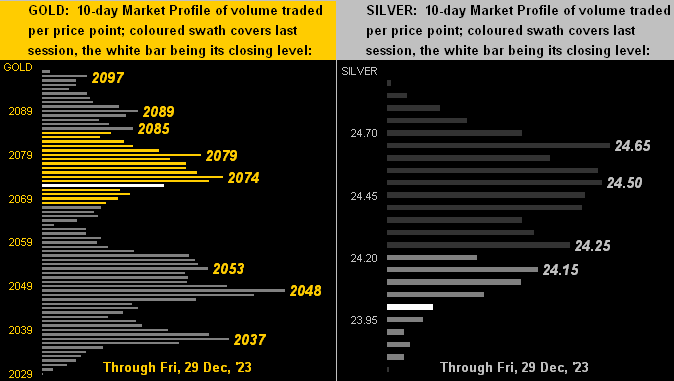
Then zooming in on the precious metals’ 10-day Market Profiles, Gold’s supremacy over Sister Silver is quite clear, the yellow metal settling the year above the Profile’s mid-point, whilst the white metal is below the same. But you already know (courtesy of the “Dept. of Redundancy Dept.”) not to forget the Silver!
So to wrap with Gold this past month having recorded a new All-Time High at 2152 and it now being both month-end as well as year-end, here we’ve the defined Gold Structure chart through the past dozen years, now featuring 2024’s goal of 2375, (conservative, or otherwise):

In transiting through New Year, one wonders how much longer the S&P 500 can withstand trading at nearly double its earnings valuation and Gold at nearly half of its currency debasement valuation. Ours indeed is to reason why — to seek reversion — for at some point it shall be nigh. And historically, ’tis always arrived.
But now for the present, ’tis time to imbibe! Thus from the entire deMeadville crew, a most Golden New Year to All of You!