The Fresh Market Inc (NASDAQ:TFM) reports preliminary financial results for the quarter ended January 31, 2015.
Specialty grocery retailer The Fresh Market (TFM) reported higher-than-expected net income of $20.2 million, up from $2.0 million in 4Q 2013, when it reported fiscal fourth quarter 2014 results on March 5, 2015. This is equivalent to $0.55 in Earnings per Share (EPS). At the same time, revenue was lower–than-expected at $480.5 million.
Net sales rose 12.8 percent to $480.5 million. Comparable store sales or sales of stores open at least a year, were up 3.0 percent to $412.3 million. The company reported $44.8 million in cash from operations vs. $35.8 million in the 4Q of 2013. Gross margin expanded 80 basis points, attributed to adjustments in promotions, pricing and costs.
For fiscal 2015, the company announced a strategic decision to exit the California market and focus its efforts on the eastern half of the United States. The Fresh Market announced it will open approximately 19 new stores during the next fiscal year.
Shares rose more than 4 percent in trading immediately after the report was announced.
This earnings release follows the earnings announcements from the following peers of Fresh Market, Inc. – Sprouts Farmers Markets, Inc., Whole Foods Market Inc (NASDAQ:WFM), Kroger Company (NYSE:KR), Weis Markets Inc (NYSE:WMK), and Fairway Group Holdings Corp (NASDAQ:FWM).
Highlights
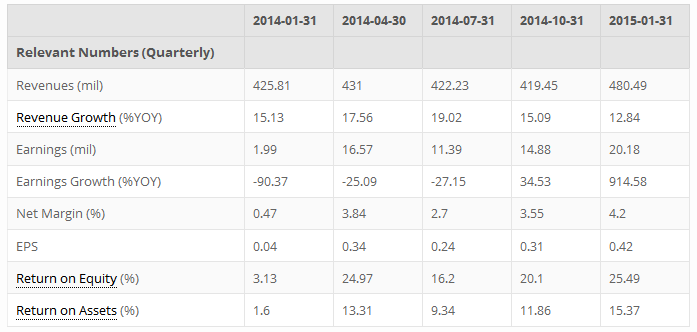
- Summary numbers: Revenues of USD 480.49 million, Net Earnings of USD 20.18 million, and Earnings per Share (EPS) of USD 0.42.
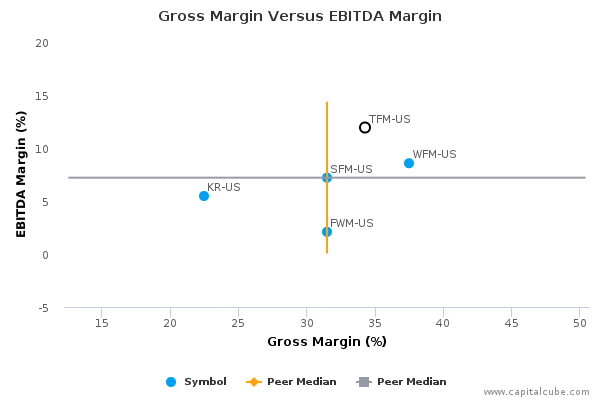
- Gross margins widened from 33.51% to 34.28% compared to the same quarter last year, operating (EBITDA) margins now 11.93% from 10.75%.
- Change in operating cash flow of 25.35% compared to same quarter last year trailed change in earnings, earnings potentially benefiting from some unlocking of accruals.
- Earnings growth from operating margin improvements as well as one-time items.
- Earnings per Share (EPS) growth exceeded earnings growth.
The table below shows the preliminary results and recent trends for key metrics such as revenues and net income growth:
Market Share Versus Profits
Companies sometimes focus on market share at the expense of profits or earnings growth.
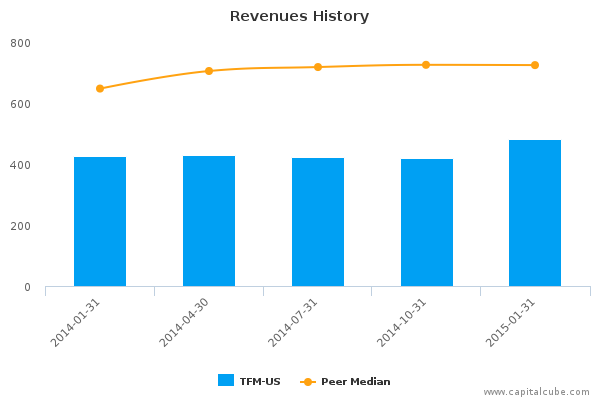
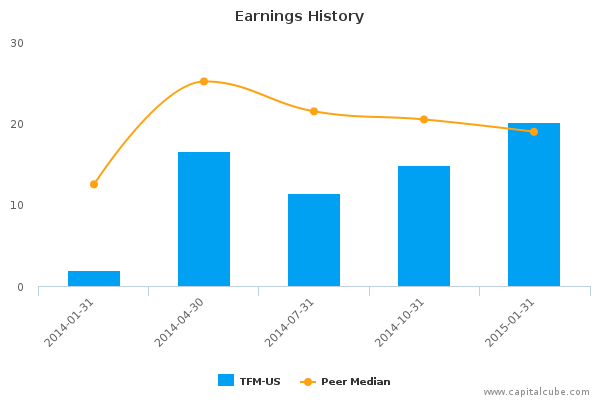
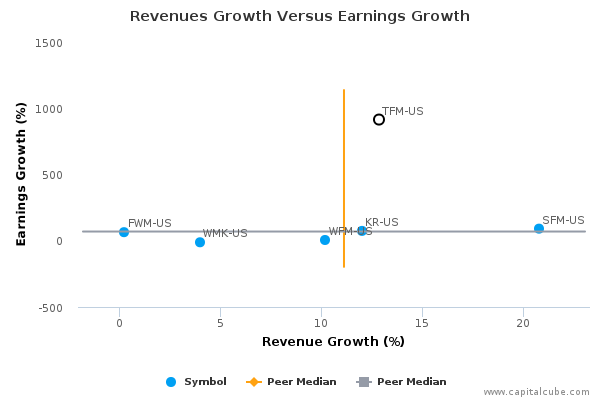
Compared to the same quarter last year, TFM-US's change in revenue trailed its change in earnings, which was 914.58%. The company's performance this period suggests a focus on boosting bottom-line earnings. While the revenue performance could be better, it is important to note that this quarterly change in revenue was among the highest in the peer group thus far. Also, for comparison purposes, revenue changed by 14.55% and earnings by 35.58% compared to the immediate last quarter.
Earnings Growth Analysis
The company's earnings growth was influenced by year-on-year improvement in gross margins from 33.51% to 34.28% as well as better cost controls. As a result, operating margins (EBITDA margins) rose from 10.75% to 11.93% compared to the same period last year. For comparison, gross margins were 32.93% and EBITDA margins were 8.90% in the quarter ending September 30, 2014.
Cash Versus Earnings – Sustainable Performance?
TFM-US's year-on-year change in operating cash flow of 25.35% trailed its change in earnings. This leads Capital Cube to question whether the earnings number might have been achieved from some unlocking of accruals. On a positive note, the increase in operating cash flow was better than the average announced thus far by its peer group.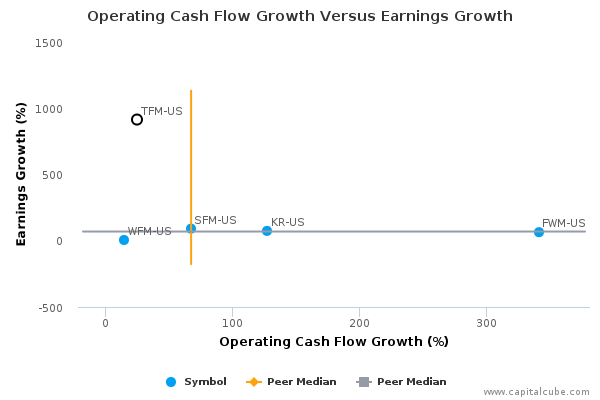
Margins
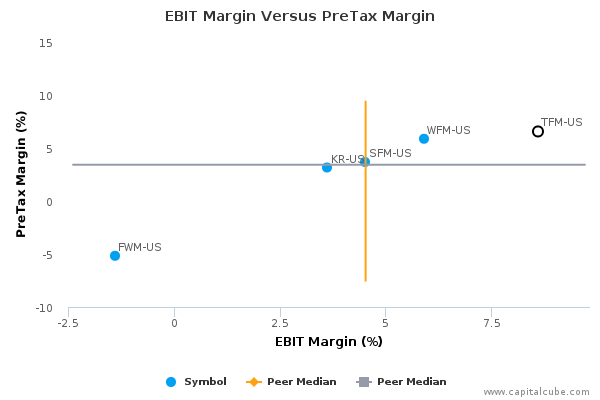
The company's earnings growth has also been influenced by the following factors: (1) Improvements in operating (EBIT) margins from 7.13% to 8.59% and (2) one-time items. The company's pretax margins are now 6.56% compared to 0.46% for the same period last year.
Company Profile
The Fresh Market, Inc. operates grocery stores. The company offers a wide range of quality food products with an emphasis on fresh, premium perishables and an uncompromising commitment to customer service. Its perishable product category include meat, seafood, produce, deli, bakery, floral, sushi and prepared foods. The company's non perishable product category consists of traditional grocery, frozen and dairy products as well as bulk, coffee and candy, beer and wine, and health and beauty. The The Fresh Market was founded by Ray D. Berry and Beverly Berry in July 1981 and is headquartered in Greensboro, NC.
DISCLAIMER: CapitalCube does not own any shares in the stocks mentioned and focuses solely on providing unique fundamental research and analysis on approximately 50,000 stocks and ETFs globally.
