2015 started out pretty much the same way it is finishing with one significant exception. In January the ECB maintained its easing mode whilst markets were feverishly anticipating a rate lift off from the US Federal Reserve, however this perspective was rocked on more than one occasion this year.
Early in 2015 the Swiss National Bank sent seismic tremors through global markets by pulling the rug on the EUR/CHF 1.20 floor in place since 2011. The SNB were forced to do this in the face of the ECB’s massive 1trillion Euro QE announcement in late January. This hugely unexpected action by the SNB took markets completely by surprise and sent shock waves through all asset markets preceding a historic liquidity squeeze, specifically within the Eurozone sovereign bond markets, as fears emerged regarding the liquidity of some of the peripheral Eurozone countries post the SNB move. The FOMC were once again sidelined as investors fled to the respective safety of the USD and the surge in USD strength leading to earnings growth concerns in the US and stress on US economic data.
The late spring/early summer was a sticky time for Forex markets as rate expectations for a US lift-off lay dashed in the wake of an unexpectedly Dovish March FOMC, compounded by heavy NFP weakness in the following months. This adjustment in expectations saw a significant shift in USD positioning which confined the majors into direction-less trading. Also at this time was the escalating Greek saga surrounding the possible debt-default and potential exit of the EuroZone by the troubled Mediterranean country. EUR flows specifically were increasingly skewed as the single currency’s inverse correlation with risk saw EUR trading lower during risk-on periods then supported as risk was scaled back. The Greek crisis was driven all the way down to last minute negotiations and beyond before finally a resolution was put in place to avoid the country’s EuroZone exit.
The next major shock wave of 2015 was delivered by another central bank from the other side of the globe when the Peoples Bank of China stepped into the markets to defend against RMB weakness versus the USD. The unprecedented intervention action by the PBOC unnerved markets during later summer, as participants panicked over a perceived slow-down in the Chinese growth story which led players to unload commodities at a record pace. Chinese growth data has continued to decline since the summer and as such so have commodity prices with many registering multi year lows, indeed as we write crude oil is printing fresh seven year lows. This precipitous decline in commodity prices has weighed heavily on commodity related FX pairs forcing the central banks of New Zealand, Canada and Australia each into multiple interest rate reductions over the year.
Now as we close out 2015 the FOMC has finally delivered the highly anticipated 25bps rate increase that the market has been primed for, as such the reaction in the markets has been orderly with the USD remaining bid. Attention will now shift to the rate of future increases and this will likely be a dominant theme in 2016.
So, in what has been another roller coaster year in the global foreign exchange markets let’s take a closer look at the dominant themes in each of our COT Signal pairs and how the indicator has performed in navigating the years momentous moves.
Overview
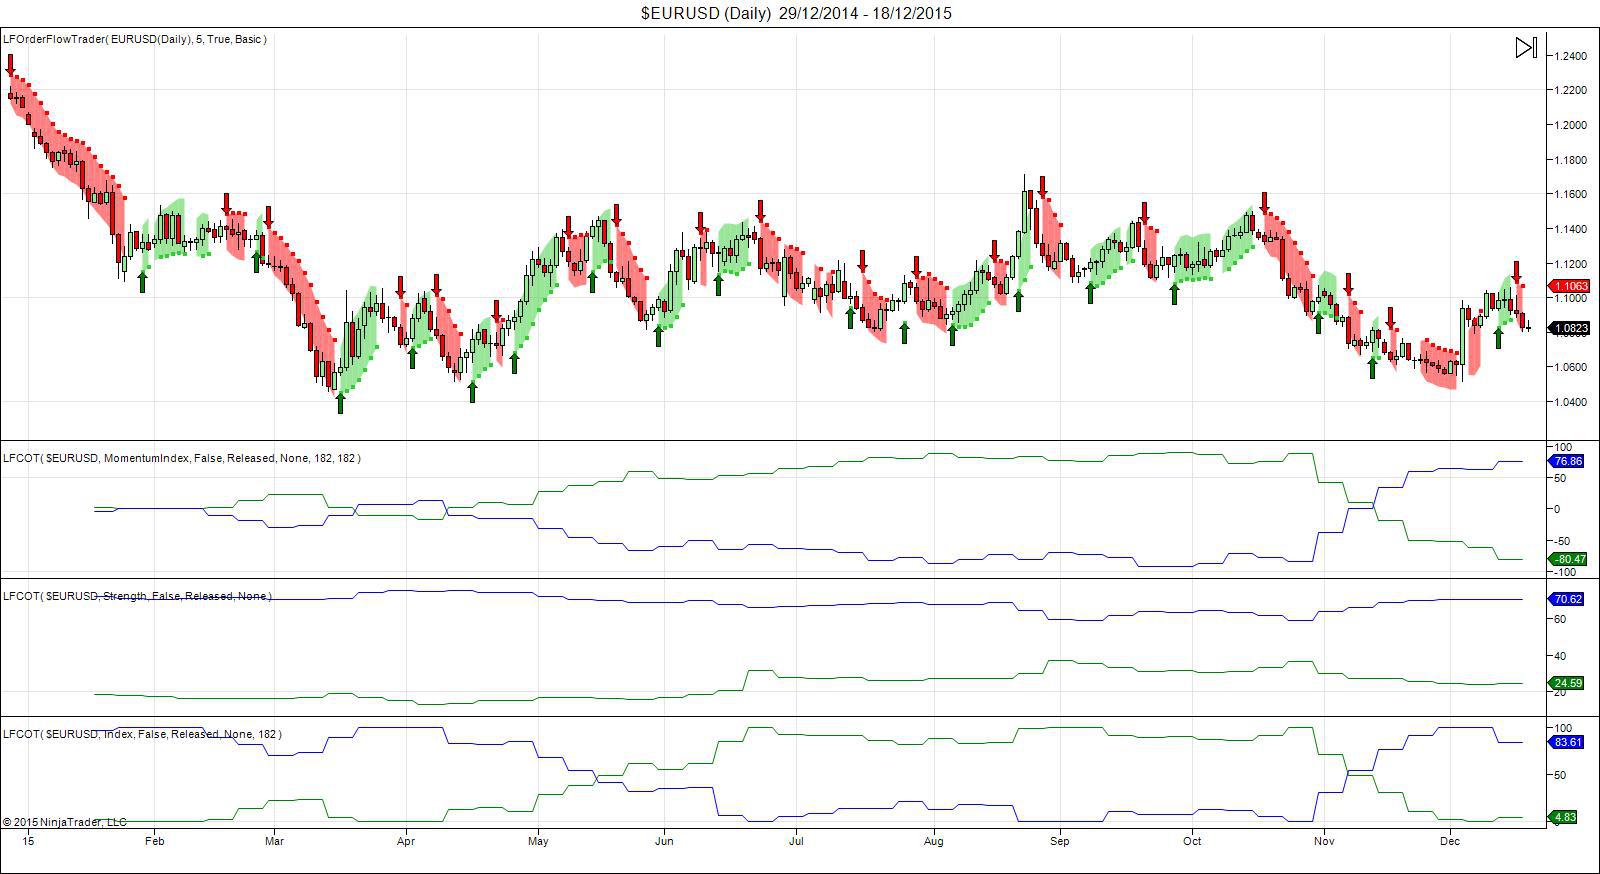
Early 2015 saw a trend continuation in the fundamental backdrop for the EUR, with most traders positioned for the policy divergence theme to continue to play out, however, the SNB move led to a sharp reversal in fortunes for the EUR, coupled with better than expected growth expectations in the Eurozone, the EUR started to find its feet before ECB members took to the wires to remind the markets that the ECB stood ready to enact further easing measures to promote inflation, which coupled with US rate move expectations weighed on the single currency. The policy divergence trade was once again reversed in recent weeks, with ECB Chief Draghi’s failure to impress the market with the easing measures announced at the December meeting. The COT indicators helped us stay on the right side of the trade. The strength signal remains short with more than 2500 pips of open profit. The short term Index and Momentum elements of the indicators secured profits on the mid year upside before recently reorienting on the short side ahead of this weeks FOMC meeting, taking advantage of renewed downside pressure post US lift-off.
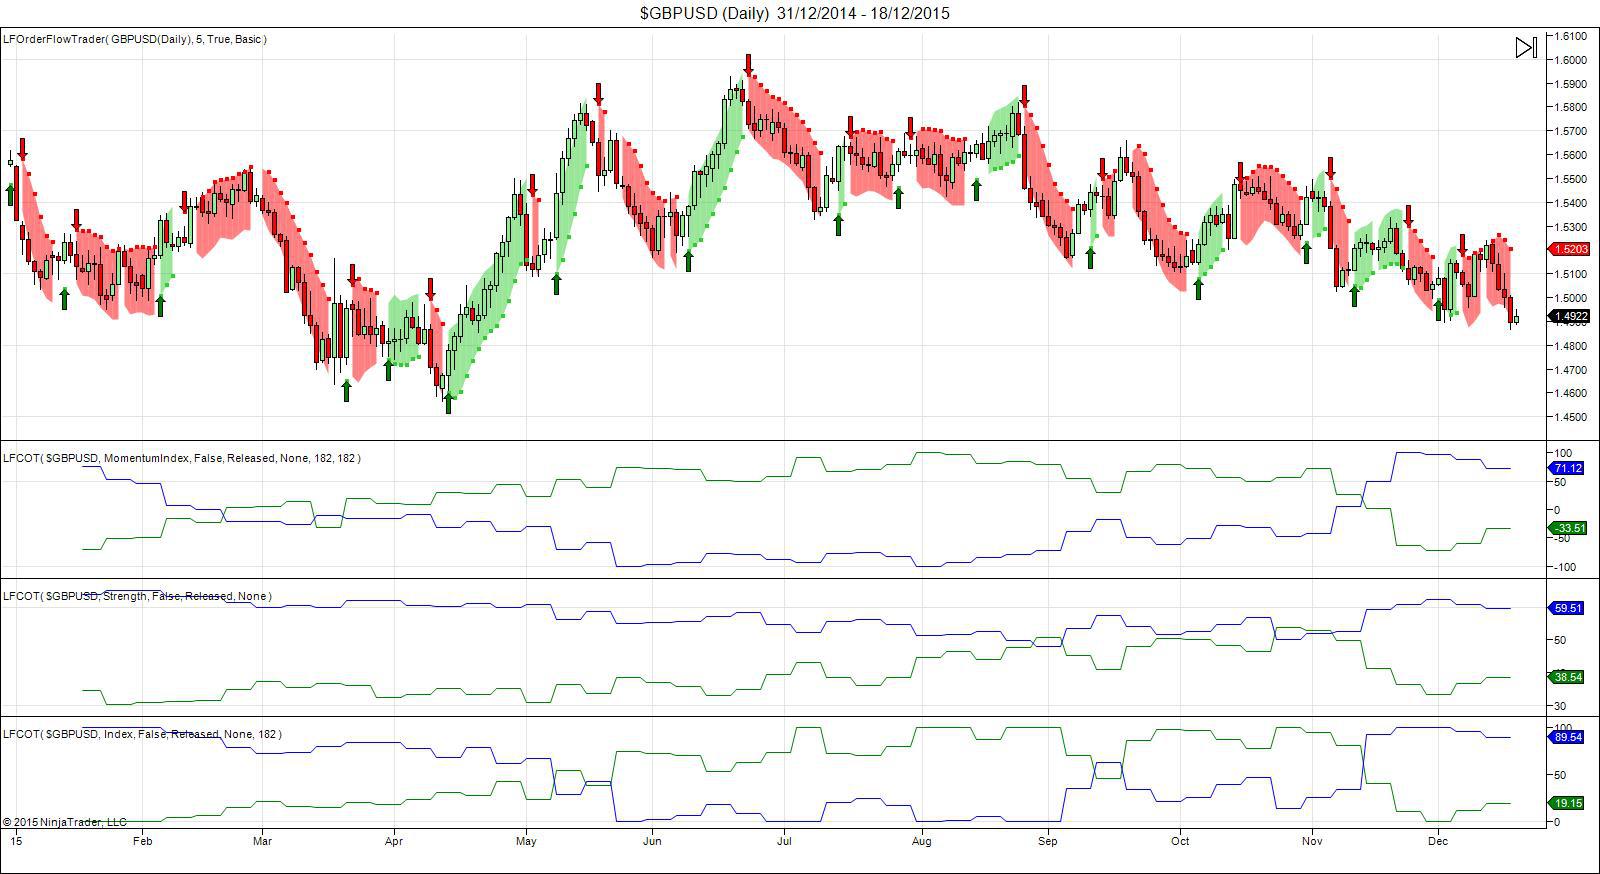
Trade in GBP/USD has been trickier over 2015, driven predominantly by numerous political concerns such as the Scottish independence referendum initially and more latterly concerns about a British exit from the European Union. The UK has also experienced its own “lift-off” circus. During the summer, hawkish expectations for a UK rate rise were growing as UK economic data continued to impress; the unemployment rate continued to decline into levels not seen since 2008, wage-growth was hitting fresh six year highs and inflation was battling it out around the 0 – 0.1% area. Reflecting these positive developments, the tone of BOE output at the time was starting to take on a Hawkish slant with BOE Governor Mark Carney commenting that the issue of a rate rise would “come into sharper relief around the turn of the year” again fuelling rate-rise expectations. These expectations were sharply unwound however as UK inflation moved into negative territory into the Autumn with the BOE suddenly sounding quite Dovish once again, lowering their inflation outlook for 2016 amidst growing concern for the domestic and global economy. This flip flopping by the UK central bank has made positioning harder to sustain in GBP/USD. For the main part the Strength element of the COT indicators has done a reasonable job of maintaining alignment with this year’s trends while the near term elements of Strength and Momentum have been more susceptible to the chop, this said the COT indicators have still managed to mine more than 2000 pips in profit from this years trade.
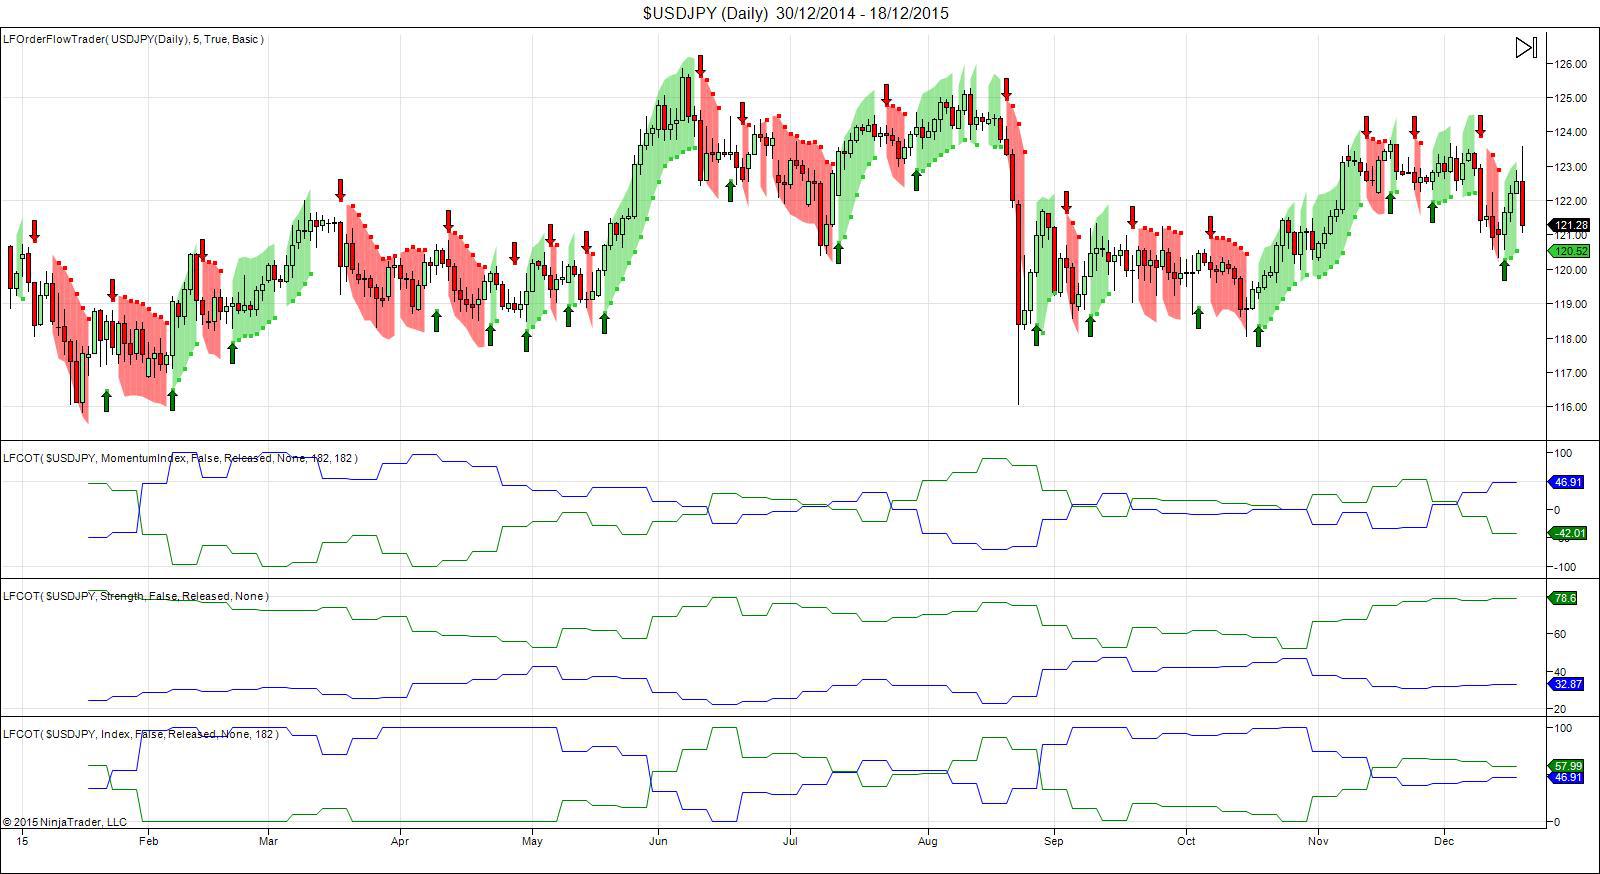
Early 2015 saw the USD/JPY grind higher as declines in domestic Japanese economic data compounded JPY weakness as the market positioned for further quantitative easing from the Bank of Japan, which coupled with growing US lift-off expectations saw rate trade above the 2007 high. A reversal in US lift-off expectations at the time alongside growing safe haven demand for the Japanese Yen saw the pair sharply lower as global growth concerns stemming from the slowdown in China continued to drive JPY strength. As the heavy risk-off tone of the late summer subsided somewhat , market attention returned to domestic weakness in Japan and expectations for further BOJ easing. Somewhat surprisingly to many players, the BOJ refrained from further easing over 2015 retaining an optimistic outlook for the economy and confidence in the current easing program. The strength element of the COT indicators did an excellent job of aligning traders with the early trending moves in although the mid year choppier trading conditions have seen the shorter term elements of Momentum and Index face tougher tests. However, the combination of the indicators has delivered just of 3000 pips profits this year proving just how well the combined trading of the separate COT indicators can work
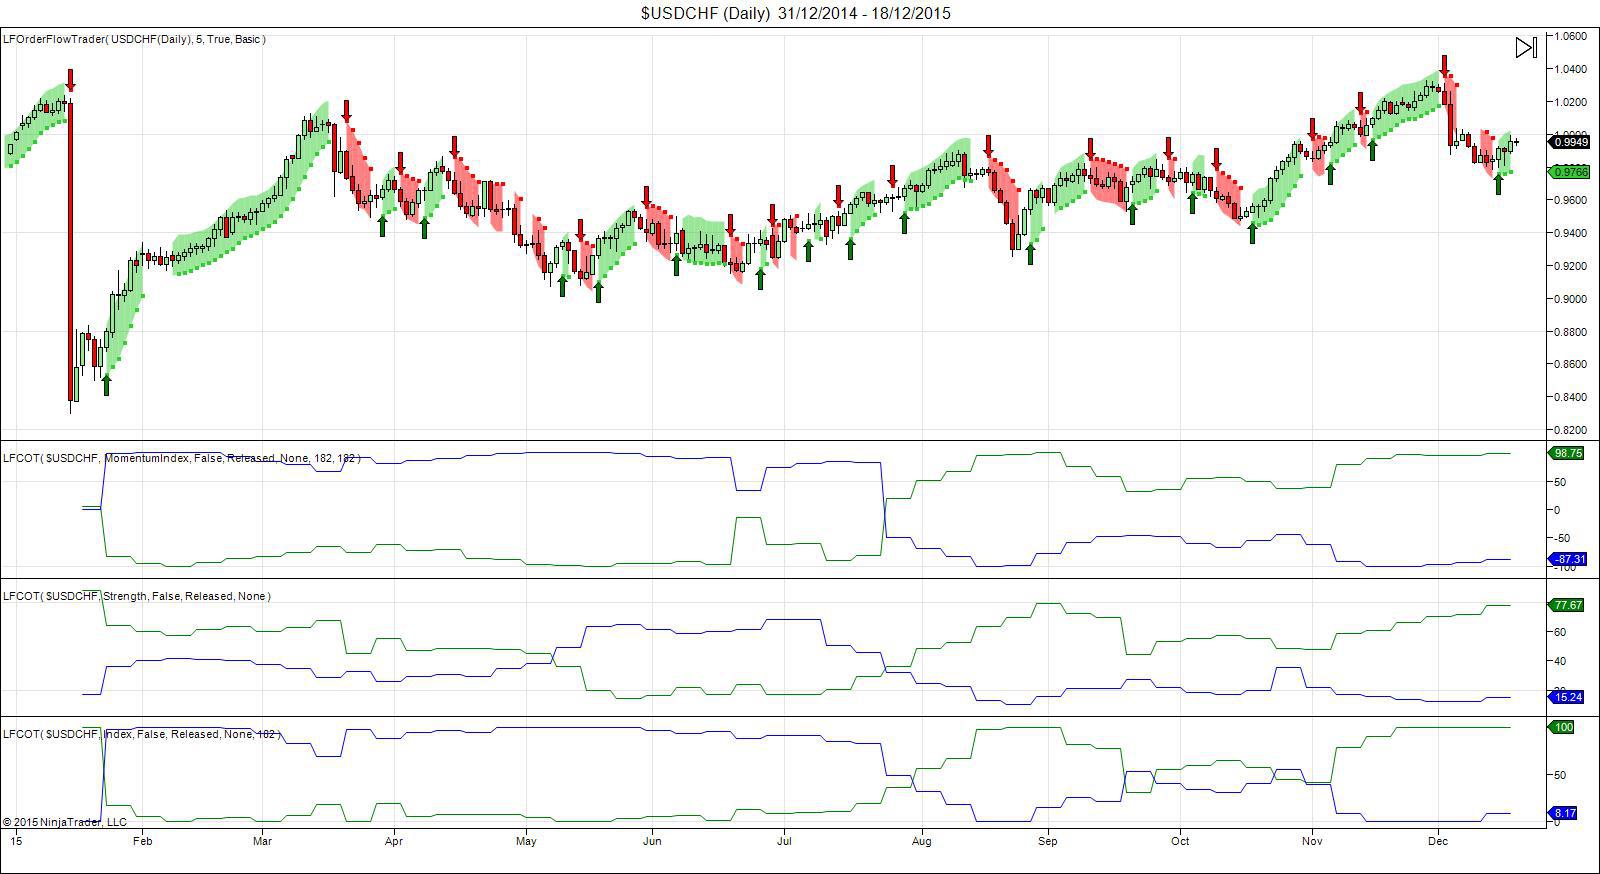
The headline story for this pair was the impossible trading conditions early in 2015 with unprecedented action from the Swiss National Bank, as the SNB reneged on the much lauded EUR/CHF 1.20 floor under the pair. The removal of the peg led to a historic liquidity squeeze across most markets but specifically in the USD/CHF which declined almost 20 big figures in the largest gap in the pair’s history. This massive move led to a period of re-calibration for the COT Indicators during which significant losses were recorded, however since undergoing a period of realignment the indicator has managed to recoup losses experienced in the first half of the year and has done a great job at capturing a large percentage of profits from the second half recovery story in the Swissy.
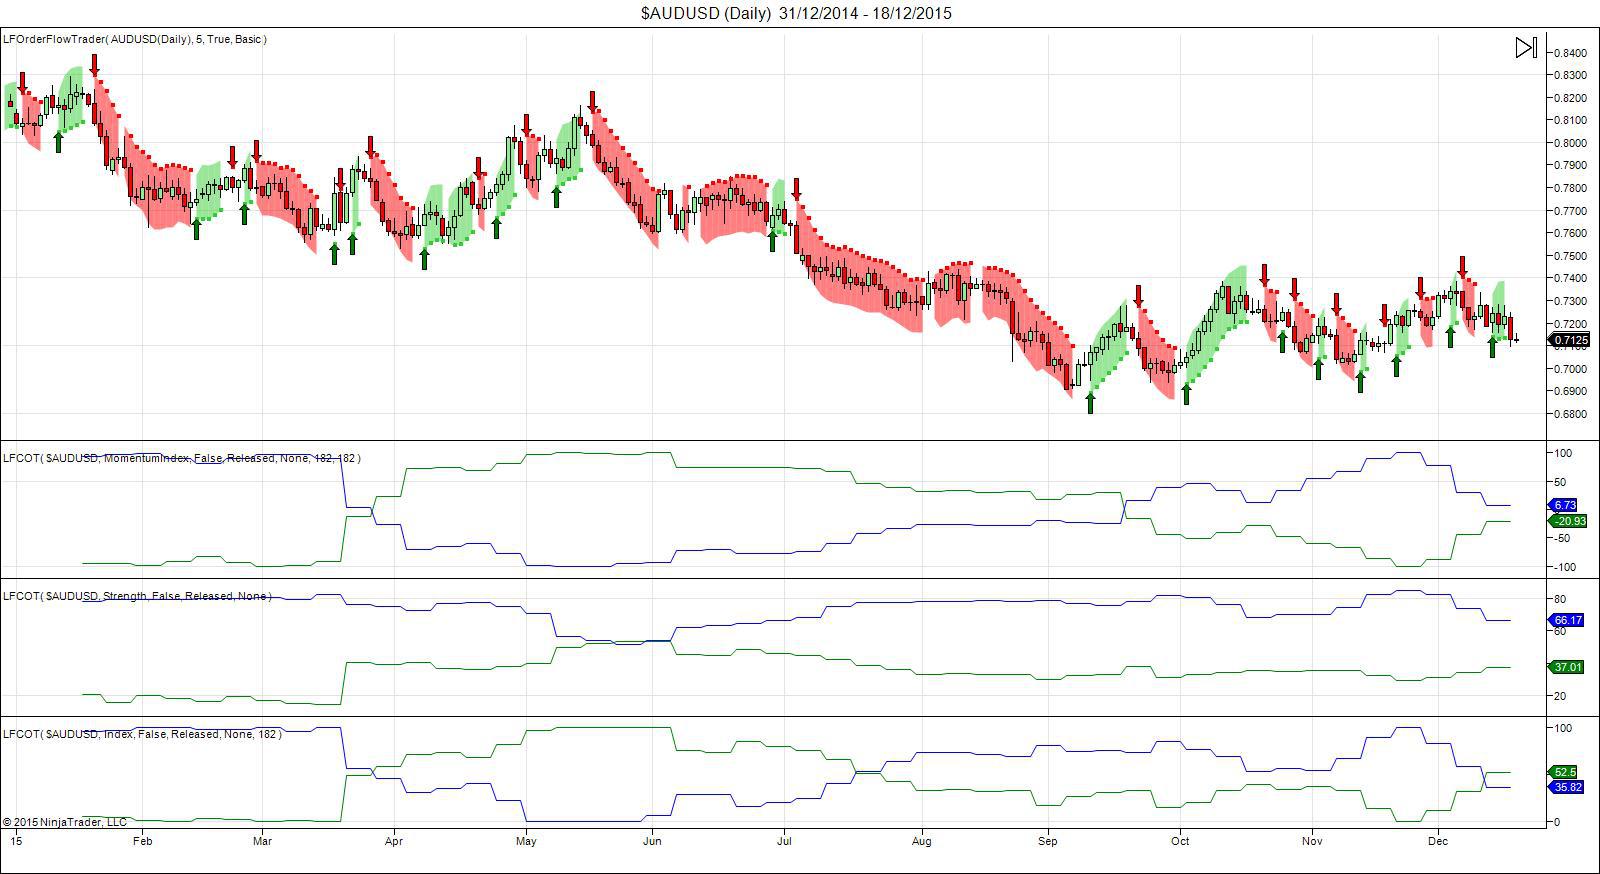
The Aussie has been the prime proxy-victim of the China growth-concern trade as one of China’s primary trading partners specifically in commodity provision. The Aussie has been heavily weighed on in a China related one two punch, firstly, the concerns regarding the growth story in China having a direct read through to the domestic growth story in Australia as a derivative trade, then secondly, as base commodities like iron ore and copper have fallen off the proverbial cliff, this has heavily weighed upon the export story for Australia. The RBA have been forced to cut rates twice this year and whilst more recently they have adopted a more optimistic tone in their economic outlook, as unemployment continues to decline,they have stressed that the scope for further easing remains. The COT indicators found a sweet spot in the AUD/USD down draft this year, after a brief foray on the long side at the beginning of the year the trio of indicators quickly flipped short and have been riding the downside profitably through the second half of the year running over 3500 pips of profit.
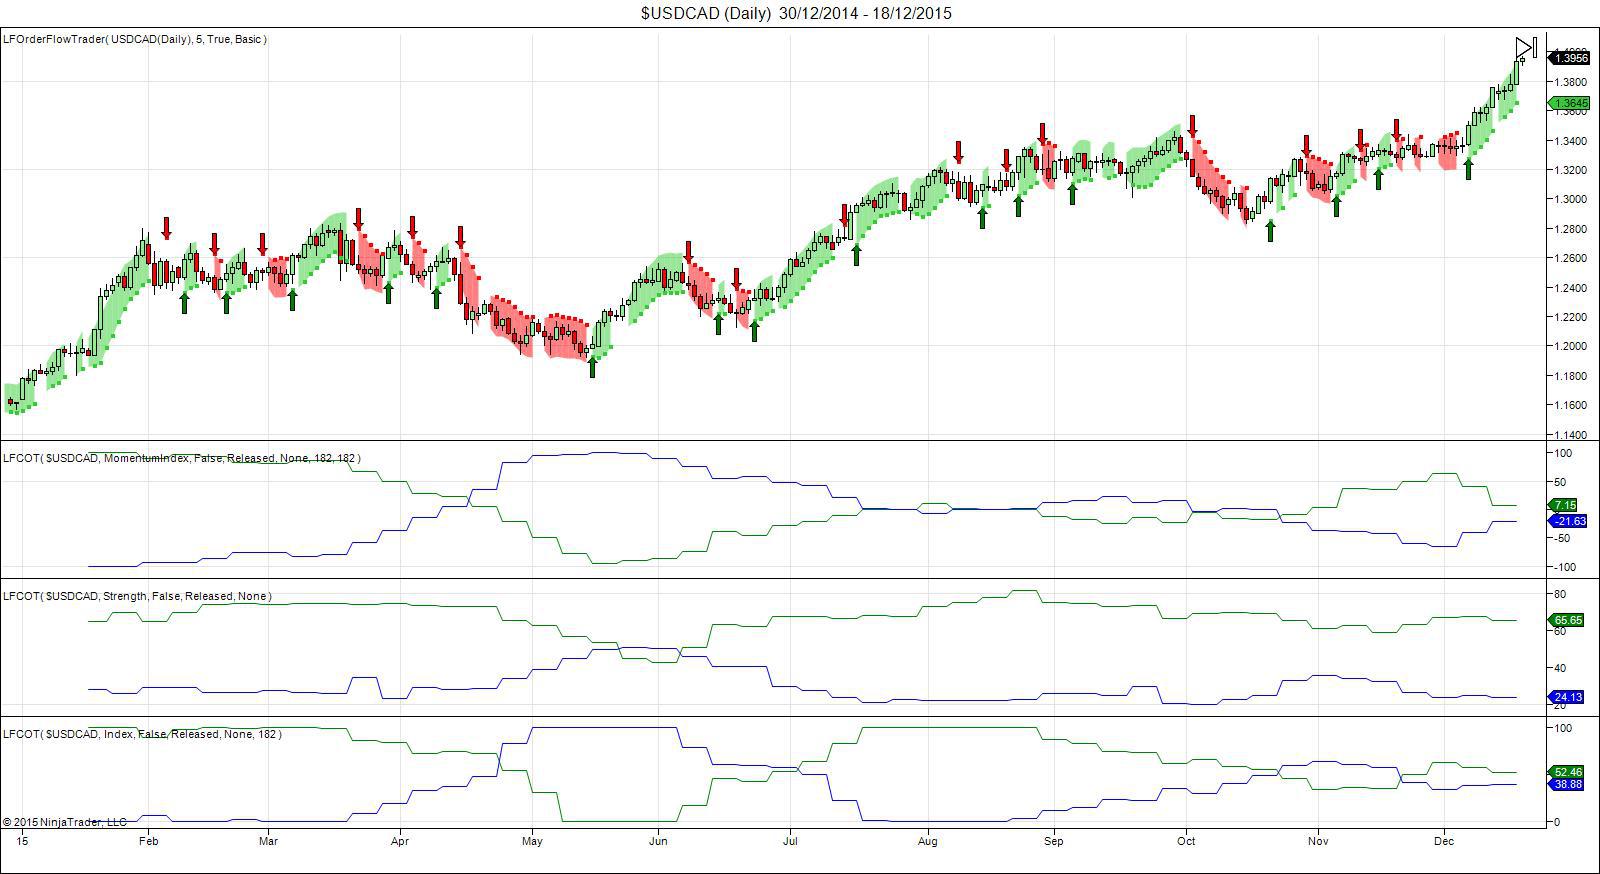
Of all the pairs the COT indicators track, USD/CAD has trended best through the balance of the year, delivering a steady stream of profits for COT Signal traders. 2015 started with a surprise rate cut by the BOC which cited the sharp declines in Oil prices and their negative implications for both growth and inflation. Despite several months of “cards to the chest” monetary policy meetings, the BOC cut rates for the second time in July as the continued Oil price declines weighed heavily on the Canadian economy. The heavy easing in CAD made it the perfect partner for US lift-off expectations as the pair once again broke into trending mode to forge new highs as Oil continued slide. Heading into the end of the year and with the US rate lift-off confirmed, alongside fresh seven year lows in Oil and the growing expectations of further BOC easing continue to drive USD/CAD higher. The dominant trend in the USDCAD has been a showcase trade for the COT indicators this year, facilitating profitable trades on both sides of the action while timing the second half trend move very well and allowing traders to profit handsomely from the larger CAD decline in the second half of the year, amassing over 4500 pips in open profit this year.

