Stocks finished the day slightly lower, with the NASDAQ 100 falling by 70 bps and the S&P 500 dropping by 20 bps. The market is waiting for the Fed now, and what is likely to be billed as one of the more important Fed meetings in Chair Jay Powell’s career.
I’m not really sure it will live up to that hype, though, because what is Powell to say? We are now thinking about, thinking about tapering?
I would be surprised if Powell doesn’t talk about tapering. I think the market broadly expects him to talk about tapering. He will likely signal that tapering is down the road. But now is really the time to bring up the subject, especially since he is covered by the ECB buying nearly $100 billion in bonds a month in Europe.
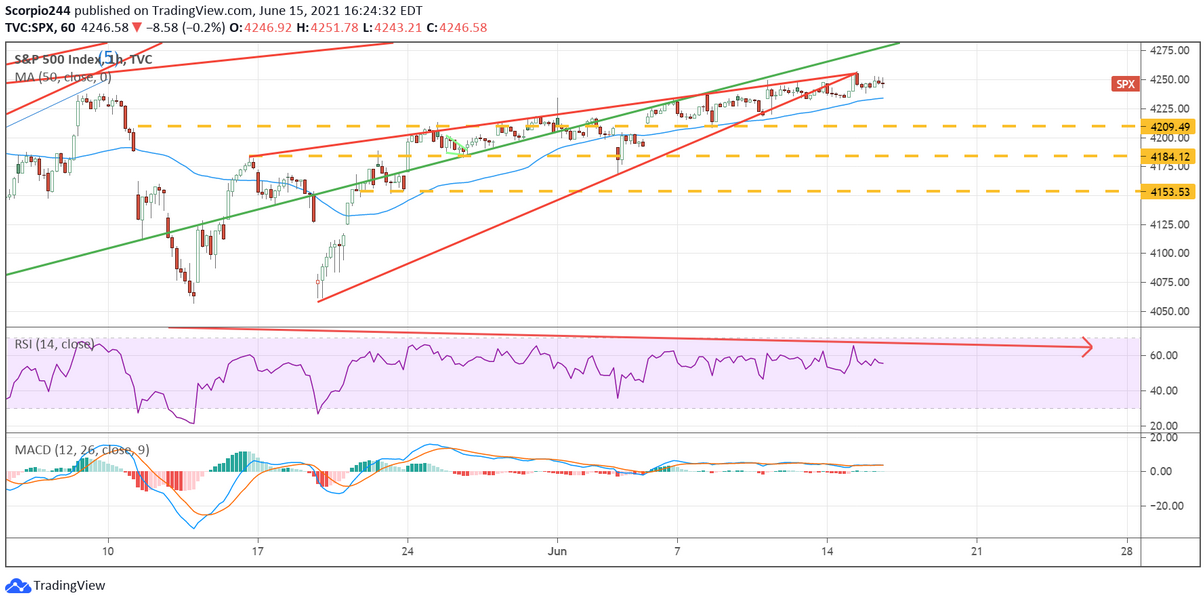
The dot plot may have more importance since it will tell you what the Fed is thinking about in terms of inflation and growth and future hikes. The technical chart for the market still shows the rising wedge. But the pattern is now complete. We did finish a little lower, but nothing too concerning.
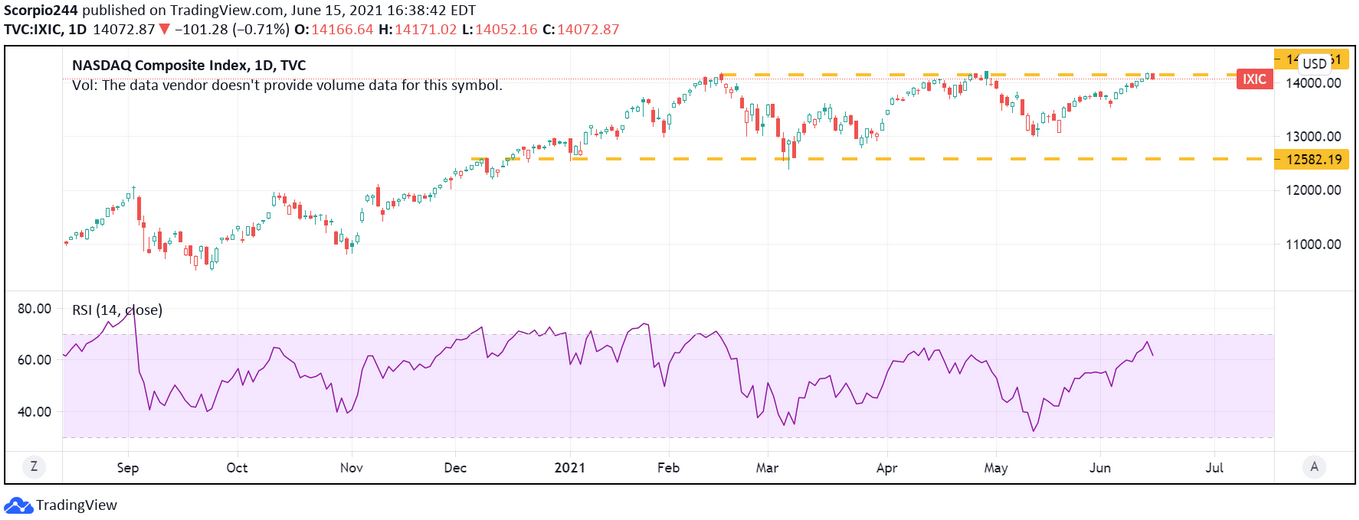
The NASDAQ Composite had one of the more perfect triple top set ups I have seen in forever. The symmetry of the peaks was amazing. The Feb. 16 high was 14,175.12. The peak on Apr. 29 was 14,211.57, and the peak on June 14 was 14,175.45. If the June 14 peak holds, I would think the composite has a chance to fall back to around 13,000. If it breaks above resistance to the upside, then it could have a distance to climb.
Yields
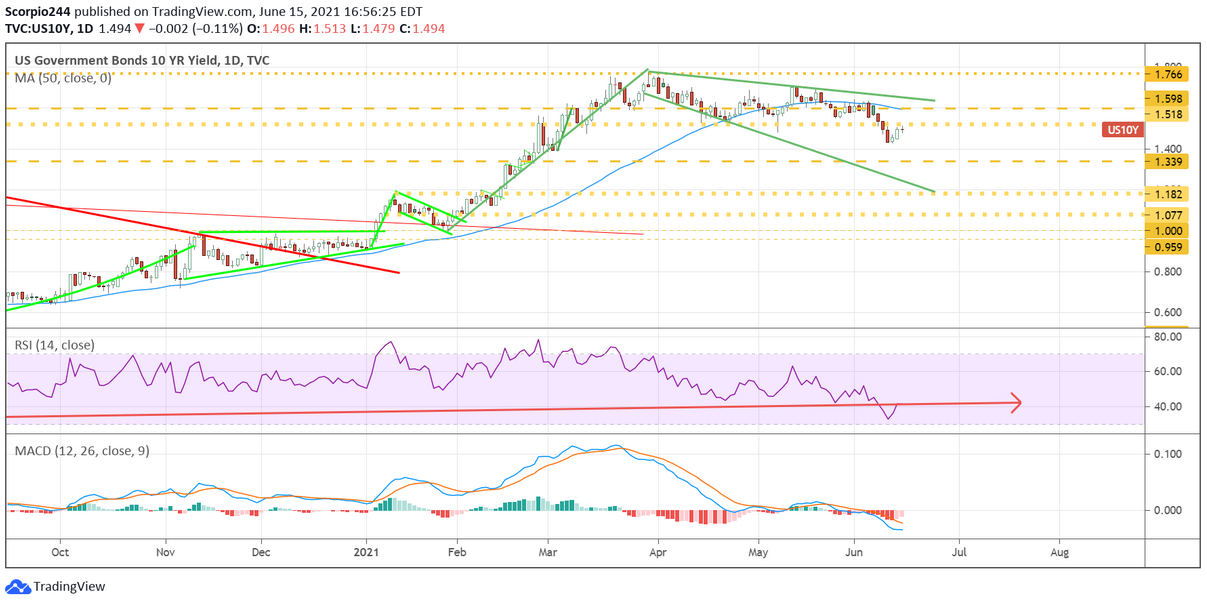
The PPI data came in very hot Tuesday, and the bond market hardly cared. The bond market was telling us something, and it isn’t good. I’m not too fond of the direction of things. This is about more than inflation being transitory.
Copper
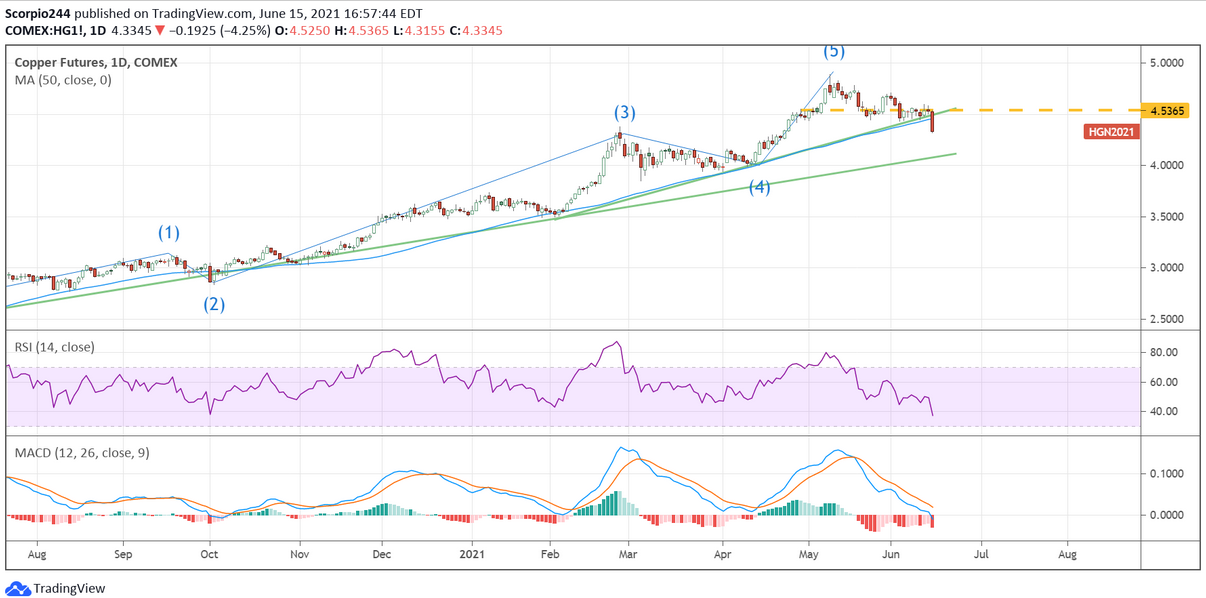
Copper prices fell 4.2% yesterday and seemed to suggest something along with Treasury rates. Copper broke a big support level and trend line Tuesday. The next stop could be $4.
Alibaba
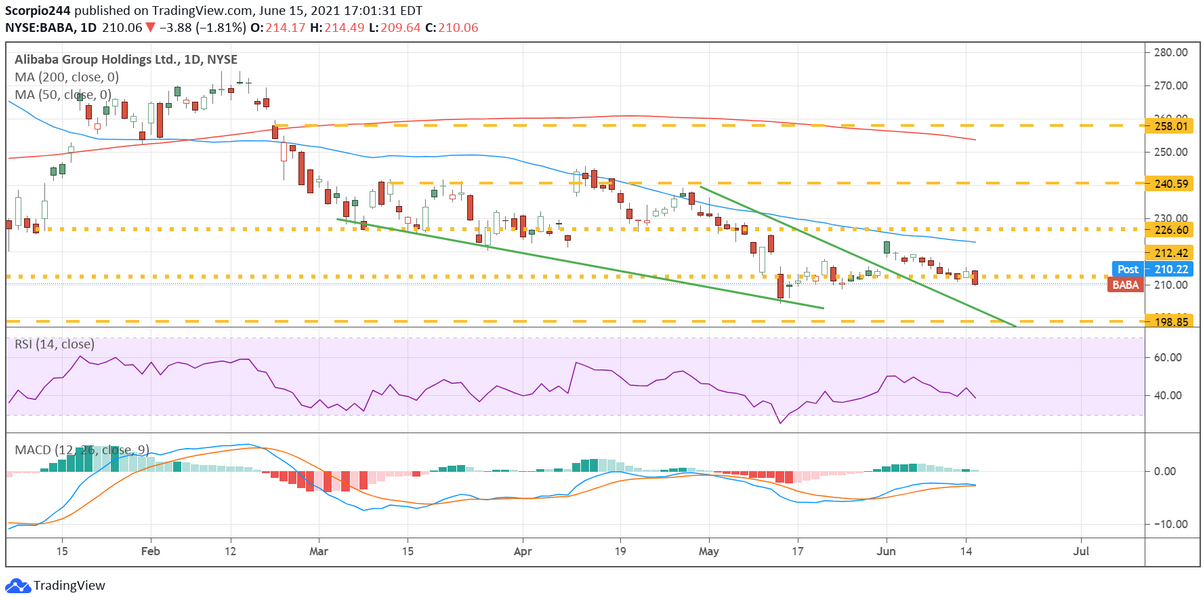
Alibaba (NYSE:BABA) was back to looking pretty weak again, with the stock falling back below support at $210.25. There is not much that is positive on the chart currently.
Freeport
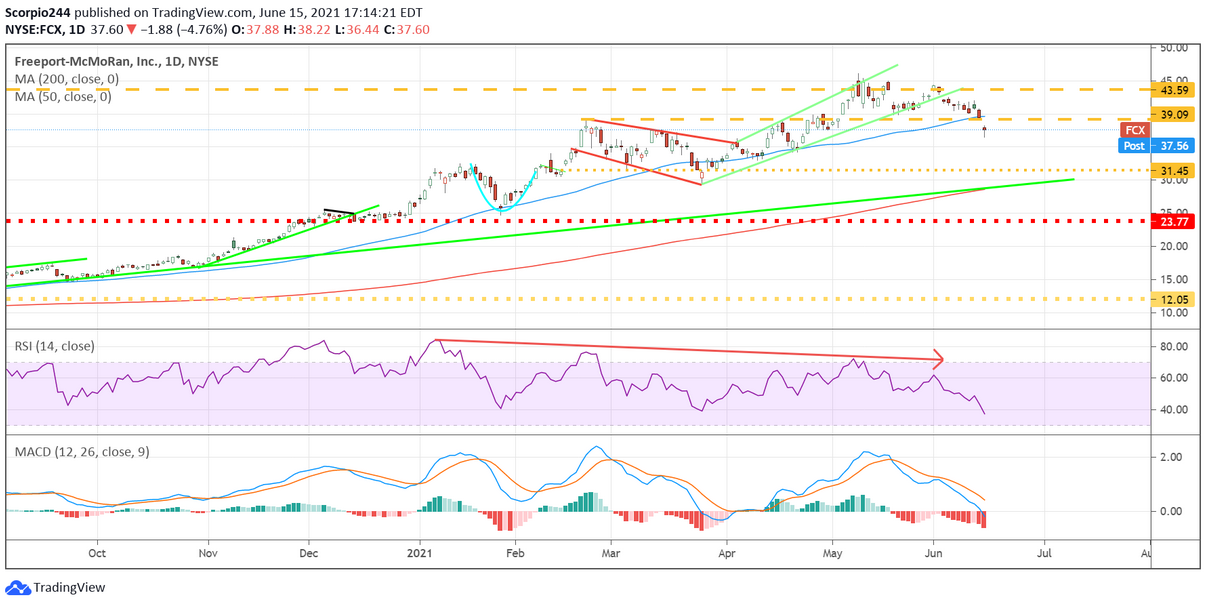
Freeport-McMoran Copper & Gold (NYSE:FCX) fell nearly 5% yesterday, following copper prices lower. The stock was trading below its 50-day moving average. However, there was some support around $34.
Citigroup
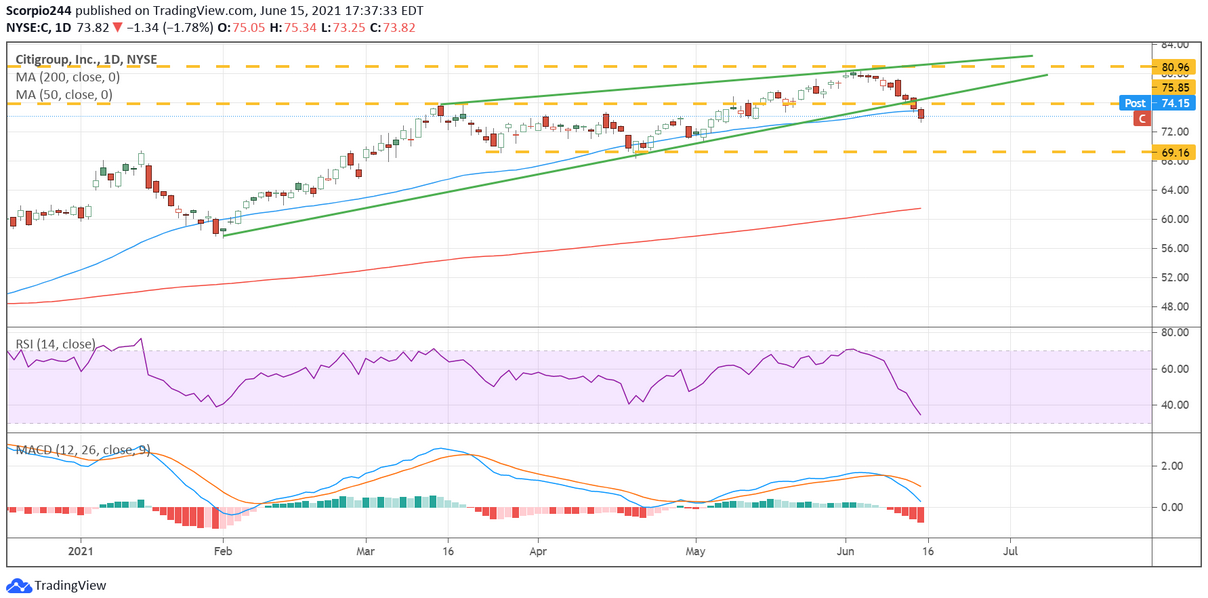
Citigroup (NYSE:C) fell 2% after the CFO noted that trading revenue was likely to fall. The stock fell below the uptrend and the 50-day moving average, with support somewhere around $69.15.
