Do you remember the halcyon days when rising interest rates and increasing interest rate differentials were the precursor to a stronger currency? Those were happy days, when life and trading were considerably more straightforward.
Scroll forward to this week’s Fed decision. As far as Fed Watch tools are concerned, and indeed many of the associated monitoring tools, a rate increase this week is a done deal, with the Fed rate tool on Investing.com rising from 88.2% last week, to 91.8% at the time of writing. This then provides Janet Yellen and her team with plenty of wiggle room to allow for a third rate increase to be factored in, but which just like Christmas shopping will no doubt be left once again to the last minute.
Given the probabilities and the prospect of more to come, it is therefore odd to consider the daily chart of the US dollar, which offers a polar opposite view of the fundamental picture. The best analogy here is one of fact and fiction. On the one side we have the Fed desperately seeking confirmation that all is well in the US economy, in much the same way political parties only seek out those polls that support their views and aspirations, which is something we saw during the UK election.
Behavioural psychologists call this confirmation bias. It's something we as traders can be prone to as well. However, for the Fed, the market is becoming increasingly disbelieving, and basing moves on the facts of economics rather than the fiction born from face-saving and ego, with the daily chart for the US dollar revealing the true story.
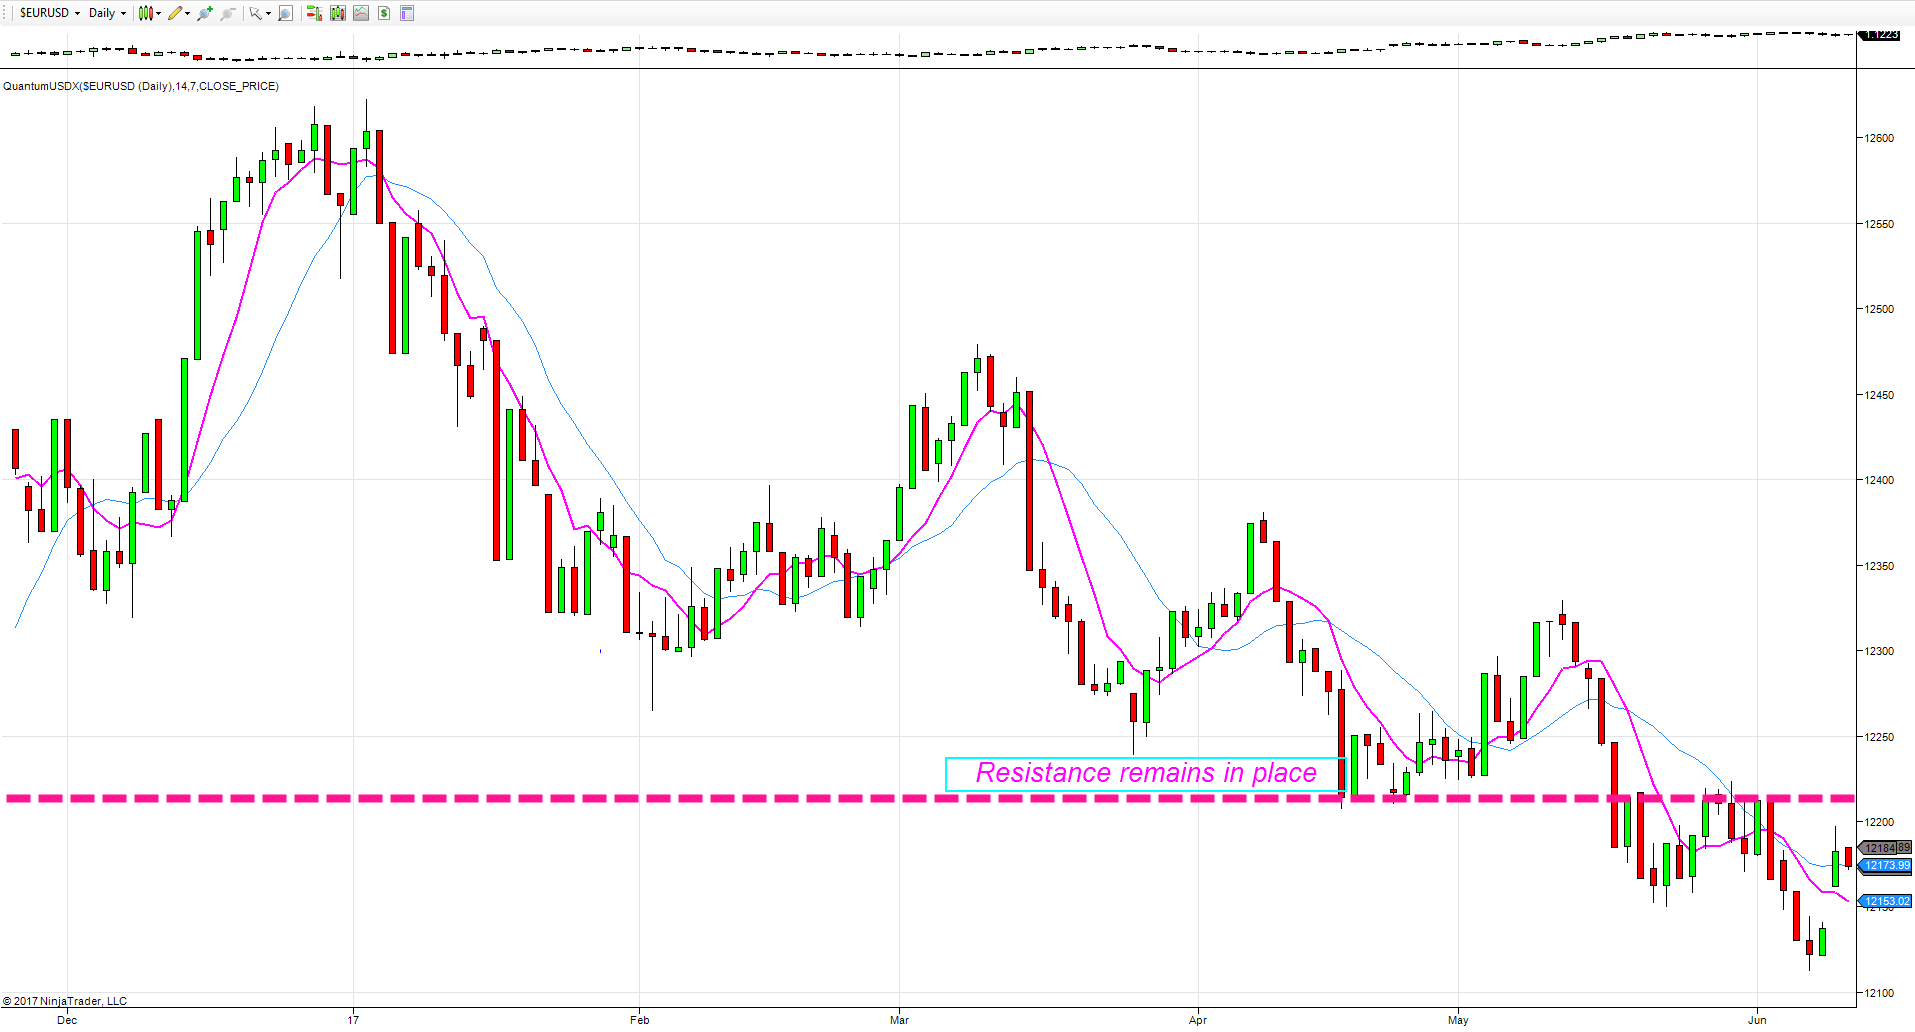
The bearish trend since the start of the year is self evident, with the high of December marking the high at just beyond the 12,600, with the index then falling in a series of lower highs and lower lows as we head into the summer months, in a classical trend lower. The resistance level at 12,220 is now clearly defined and denoted with the pink dotted line, a region which has been tested several times in May, but duly holding on each test and adding further downwards pressure.
The message here is clear. The markets no longer believe anything the Fed says or does, with this strong divergence set to continue this week, and indeed it was interesting to note the aggressive fall in the NASDAQ last week, which has continued in early trading today. It suggests this sector is struggling, sending a strong signal of weakness from an index which generally leads the way out of recession and into an early expansionary phase.
The associated press conference with Janet et al will no doubt continue with the theme of ‘reasons to be cheerful’ with the markets then taking the opposite view based on fact and economic outlook.
