Small-Caps Continue To Rally: The broad US equity market stumbled over the five trading days through Friday, Nov., 20, but shares of small companies ignored the setback and powered higher for a second straight week.
At one point this week, iShares Core S&P Small-Cap (NYSE:IJR) was trading at a new high for 2020 before pulling back by today’s close. But the bullish momentum was strong enough to lift the ETF up 2.6% – the second best weekly performance for our proxies of the major asset classes.
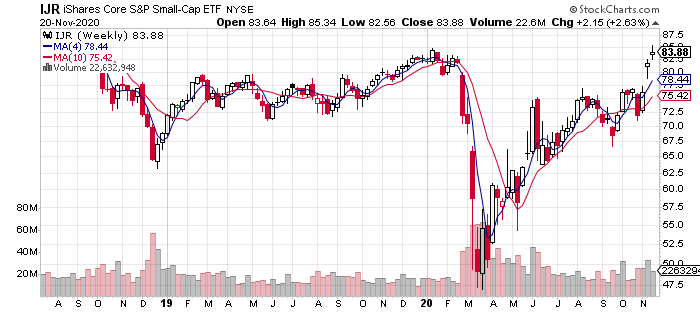
Note, too, that IJR gapped up for a second straight week. And as shown in the table below, IJR’s momentum profile has joined the party and is currently ranked 100 for our proprietary score – the highest level of bullish trending behavior. On a year-to-date basis, IJR is up a modest 1.3% -- far below the broad US equity market’s 13.5% rally this year, via Vanguard US Total Stock Market (NYSE:VTI). The implication: IJR’s rally still has room to run, at least on a relative basis vs. VTI. (For details on all the risk metrics as well as the strategies and benchmarks, see this summary.)
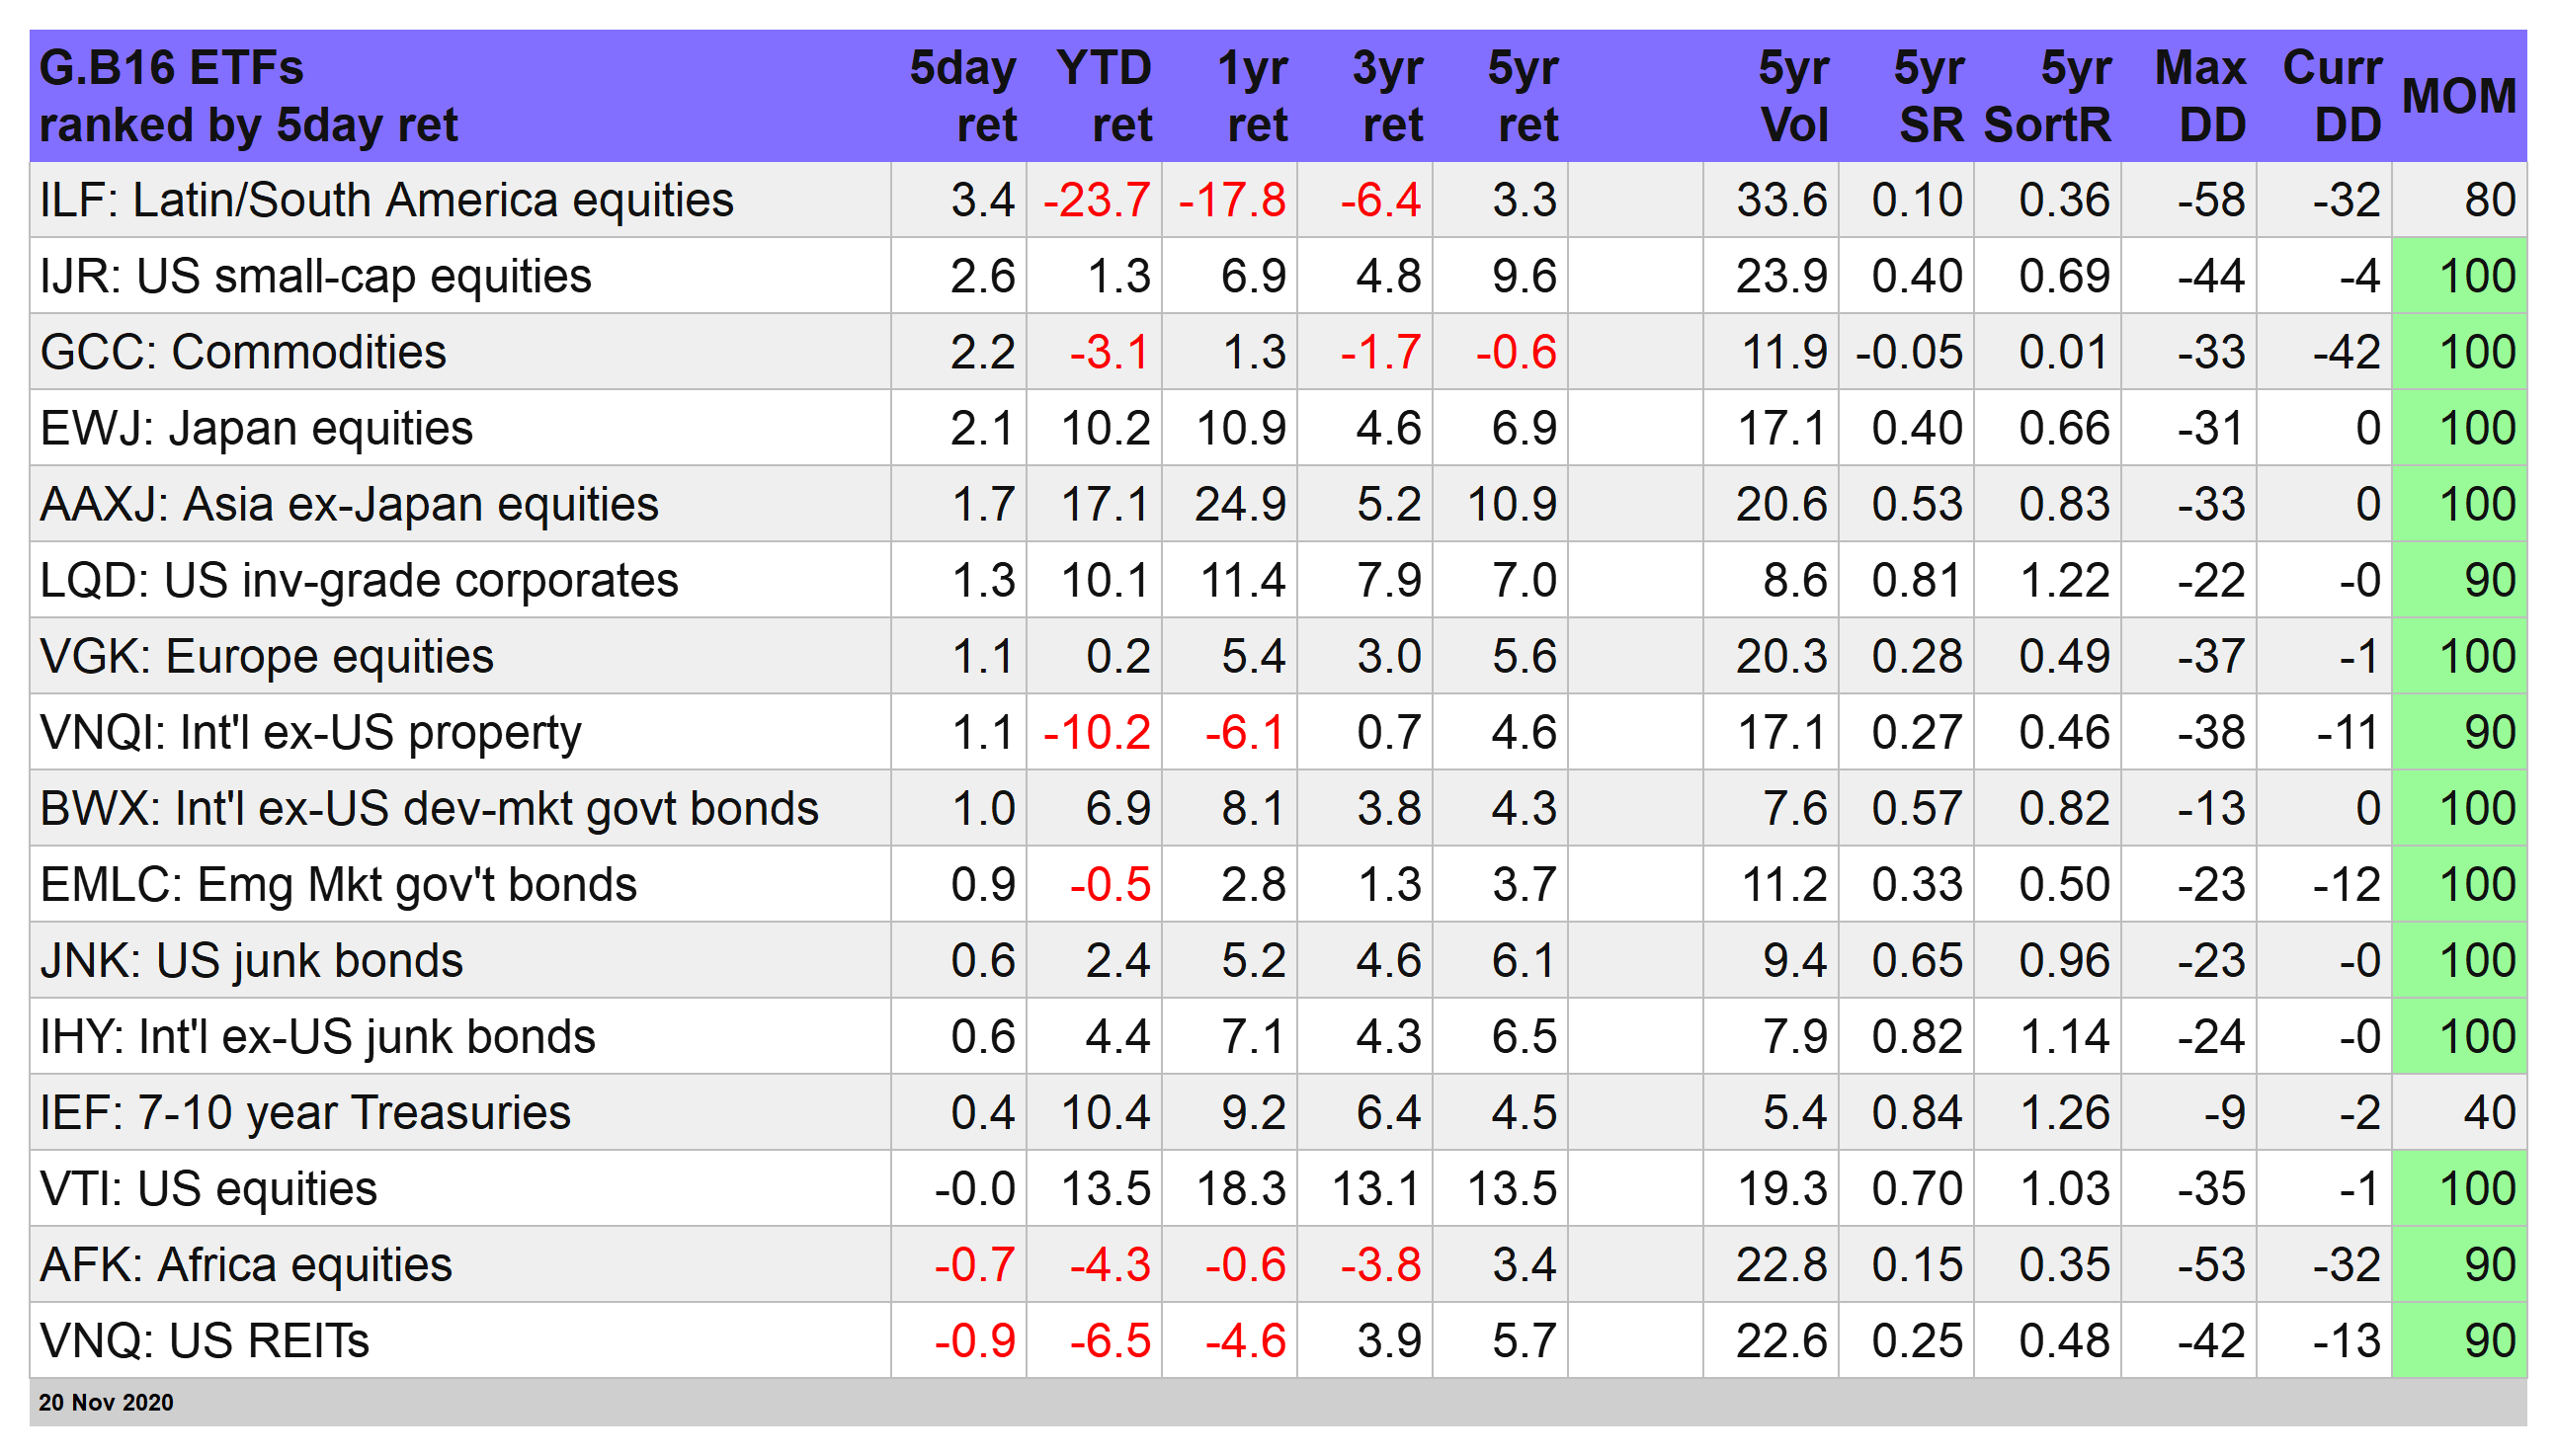
Speaking of gapping higher, add iShares Latin America (NYSE:ILF) to the list. The ETF, the top performer for our global survey of risk betas, rose for a second week by trading above the previous week’s range. In contrast with US small caps, however, ILF remains well below its pre-pandemic level.
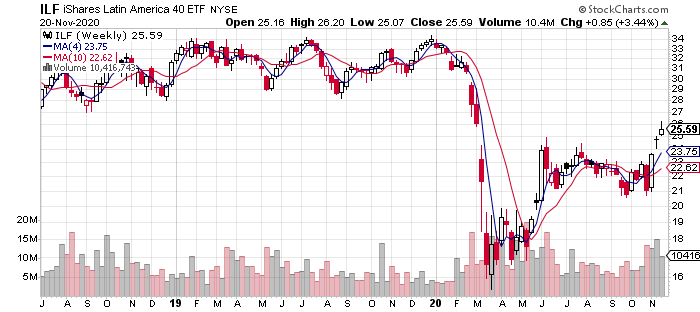
The week’s red ink was limited to stocks in Africa (NYSE:AFK) and US real estate investment trusts (NYSE:VNQ), the worst performer via a 0.9% loss from the week-ago price.
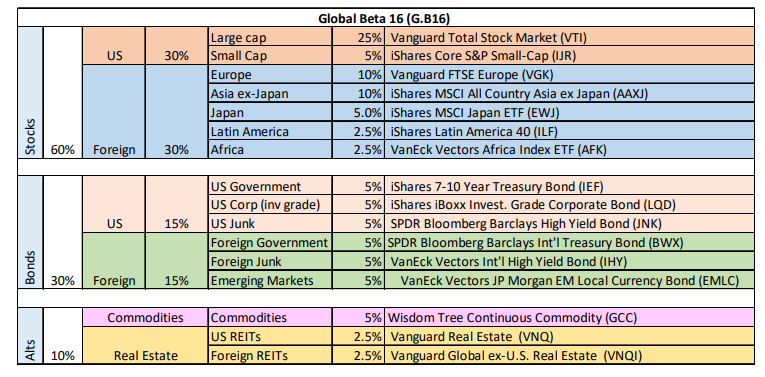
Global Diversification Pays Off: Turning to our portfolio benchmarks, going global remained beneficial this week. Global Beta 16 (G.B16), our primary yardstick that holds all the ETFs in the table above in quasi-market weights, rallied 0.7% this week – well above the 0.2% gain for the 60/40 US stock/bond mix, which continues to dominate year-to-date performance for benchmarks in the table below.
Overall, it was hard to lose money this week. With nearly every corner of the risk landscape popping, a portfolio of widely held betas delivered respectable gains. The results weren’t as strong as the previous week’s surge, but the gains are impressive when you consider that coronavirus risk appears to be rising globally as the disease continues to take a higher toll in fatalities and hospitalizations.

Our trio of proprietary strategies hitched a ride on the week’s bullish trend. Global Managed Volatility (G.B16.MVOL) and Global Managed Drawdown (G.B16.MDD) each rose 0.8%.
For the year so far, however, G.B16.MVOL continues to lead by a wide margin over its two counterparts. The strategy stumbled, briefly, in September, but has rebounded sharply in subsequent weeks and appears on track to deliver a red-hot performance for 2020 overall (see performance chart below).

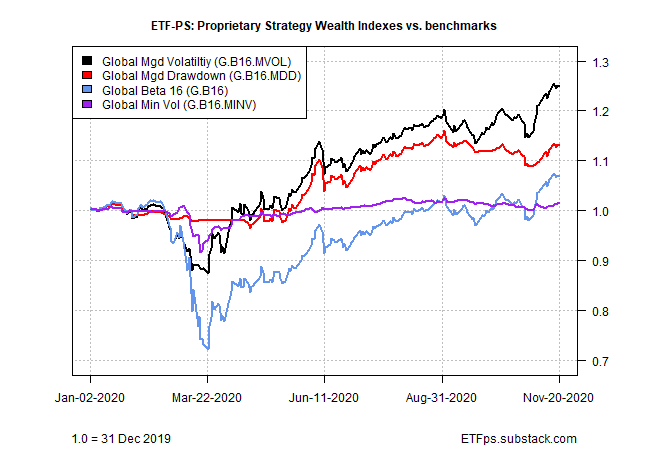
G.B16.MVOL continues to run with a full-out risk-on profile for all its holdings (the same tickers as the G.B16 benchmark). For the moment, G.B16.MVOL’s risk-management overlay has added a strong dose of alpha relative to the passively run G.B16 that targets the same opportunity set.
G.B16.MDD remains mostly risk-on, too (as a reminder, this strategy also holds the G.B16 opportunity set but uses a drawdown-based strategy to manage asset allocation). The lone exception: iShares 7-10 Treasury Bond (IEF) remains a risk-off bucket for G.B16.MDD. Meanwhile, foreign government bonds in developed markets (BWX) switched back to a risk-on position as of today’s close.

G.B16.MDD has suffered a degree of whipsaw in recent months, which accounts for its trailing performance relative to G.B16.MVOL. Drawdown can be a valuable signal for monitoring risk, but it’s had some troubles lately, at least in the formulation currently employed in G.B16.MDD.
Finally, BlackRock’s four takes on global asset allocation had a good week. On all risk fronts, these ETFs look set to report a solid 2020 run.

What could go wrong? Coronavirus tops the list, which includes a new run of economic blowback as the disease rebounds. Although vaccine R&D continues to offer hope for a better 2021, getting from here to there will likely be a rough ride as the logistics of distribution move to the fore.
For now, the markets don’t seem to care. Is that because markets are pricing in brighter days ahead (on the assumption of wide vaccine distribution)? The counterpoint: markets are underpricing risk and things that may still go bump in the night.
Short of a surge of disappointing news on the vaccine front, it seems that the former story line will remain front and center and continue to animate risk pricing.
