I have written extensively about the relationship between the Dow and silver prices. One of the points I have emphasized is the fact that Dow peaks are often followed by silver rallies.
Given the above, its natural that the Dow/silver ratio is also an important indicator for future silver prices. One example of this, I deal with in my silver fractal analysis report:

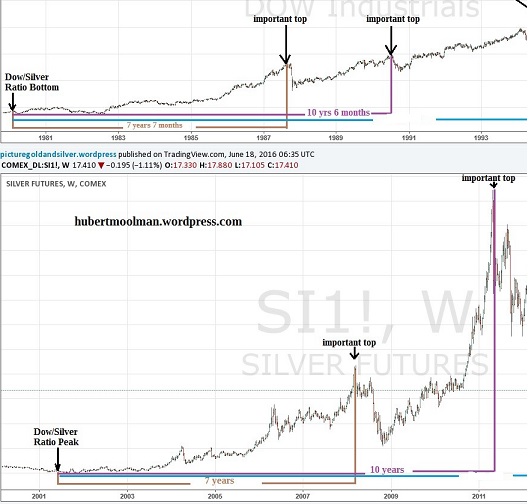
The top chart is the Dow (from 1980 to 1994), and the bottom is silver (from 2000 to 2012).
In 1980, the Dow made a bottom, as measured in silver (Dow/silver ratio bottom). For silver, a similar bottom would be when the Dow/silver ratio peaked in 2001. For both charts, these points (respectively) were at significant lows (significant lows just before the start of the bull market).
The first important peak for the Dow, since the Dow/silver ratio bottom came about, was after 7 years (and 7 months). For silver, the first important peak came about 7 years after the Dow/silver ratio peak.
The second important top for the Dow came about 10 years (and 6 months) after the Dow/silver ratio bottom. For silver, the second important top came about 10 years after the Dow/silver ratio peak.
This clearly shows that there is a measurable relationship between silver prices and the Dow, and that one can use the Dow/Silver ratio to help predict future silver prices. For example, this ratio could be very instrumental when formulating an exit strategy for silver.
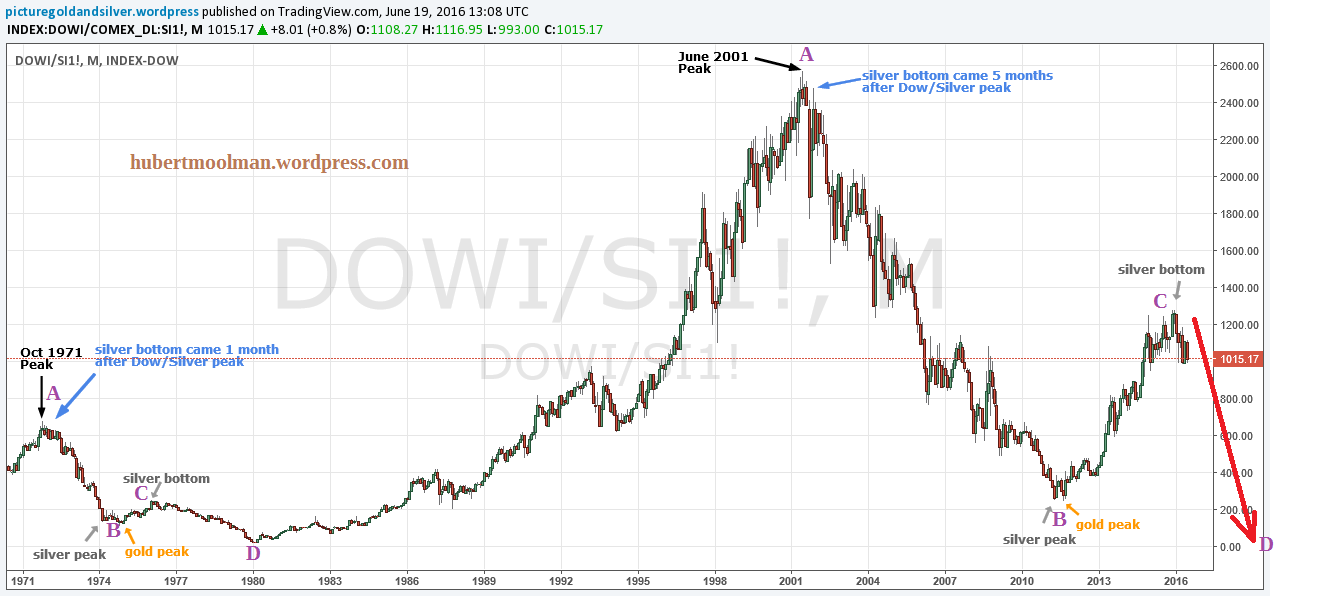
Below is a long-term chart of the Dow/silver ratio:

On the chart, I have indicated some key financial events. I have also marked two fractals (A to D). Both fractals, or patterns, exist in a similar manner relative to the key events indicated.
Point A (of both patterns) is at the peak of the Dow/silver ratio, just before the start of the silver bull market. In both cases, silver made a major bottom, soon after the Dow/silver ratio peak.
Point B (of both patterns) is the bottom of the Dow/silver ratio, just after a significant silver peak.
Point C (of both patterns) is the top of the Dow/silver ratio, right at a significant silver bottom. On the 1970s pattern, point C was the low before we eventually had the rally that took silver to the then all-time high of $50.
If the comparison of the two patterns is justified, then we will have a similar rally (in the near future) that will take silver to a new all-time high. Furthermore, the top of the Dow/silver ratio in 2001 is most likely a mega-top. Given that this is likely a mega-top, I would expect the Dow/silver ratio to go lower than the 1980 low.
