I’ve always been a big proponent of following the major trends in the market to serve as guideposts for sizing the stock allocation of my portfolio. Trend lines like the infamous 200-day moving average have never been a perfect predictor of stock market direction. However, using these types of technical indicators can serve as a useful tool for making incremental adjustments over time.
Pacer ETFs is a relatively upstart company in the exchange-traded fund world that operates a suite of TrendPilot ETFs designed to automate the trend following process. Their lineup includes a range of well-known U.S. and European indexes with several hundred million in combined assets under management.
The largest and most popular fund in their mix is the Pacer TrendPilot 750 ETF (NYSE:PTLC), which is based on the Wilshire U.S. Large-Cap Index. This includes a diversified basket of 750 large-cap stocks that aims for broader exposure than the stalwart S&P 500 Index.
PTLC currently has $336 million in total assets and enough consistent daily trading volume to be considered liquid for most investor’s purposes. It also charges an expense ratio of 0.60%, which is on the high side for a typical ETF but not necessarily abnormal for a quasi-active approach.
The basic premise behind PTLC is to participate when the stock market is going up and move to cash (or treasury bills) when it is going down. They accomplish this through a systemic, rules-based methodology that indicates when a positive or negative trend is established using the 200-day simple moving average.
In an uptrend, PTLC owns 100% stocks. The fund then moves to 50% stocks and 50% treasury bills when the index falls below the trend line for five consecutive days. It then uses a final confirming indicator to move to 100% treasury bills if the simple moving average falls lower than its prior reading for five days. The process starts over again once the index regains its 200-day moving average on the upside.
Simple. Logical. Automated. Sounds easy right?
The obvious advantage of this strategy is that it is designed to keep your money safe during a prolonged bear market such as we experienced in 2008. Multiple months or even years of persistent selling pressure can be avoided by having your capital protected near the top quartile of a new down cycle. The goal is also to get you back into the market at a much lower point and with more starting capital than if you had held your way through on the downside.
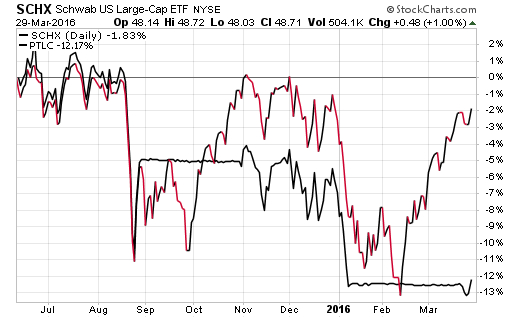
However, this trend following system also becomes a hindrance during periods of sharp corrections and subsequent rapid recoveries like we have experienced over the last year. The constant gyration from bullish to bearish momentum and back again creates a counter-productive effect on the strategy.
When comparing PTLC versus the Schwab U.S. Large-Cap ETF (NYSE:SCHX) since inception, you can see how the trend following strategy moves to cash prior to the upswing in both 2015 and 2016. This means that you miss out on the recovery phase and end up rapidly falling behind the more conventional index. SCHX purely follows the Wilshire U.S. Large-Cap Index without the trend following component.

The time period involved here is admittedly quite short and a proper analysis should be done over multiple cycles of the market. Nevertheless, it should be observed that this recent trading pattern does not sit well with a trend following strategy built to follow a long-term moving average. It may also result in some investors becoming frustrated with the timing component and jumping ship just prior to the market rolling over once again.
The trend following ETF is ultimately doing exactly what its creators set out for it to do. The more recent price action should be considered a known risk of this type of enhanced index rather than a failure of the strategy altogether.
The lesson is that there is always a double edged sword of opportunity cost that must be considered when you move to the safety of cash. This same risk is entrenched with the use of stop losses or physical sell orders for individual ETFs and stocks as well. They call it getting “whipsawed” and it is certainly an uncomfortable feeling when you are on the wrong end of it.
