The dollar rallied against almost all its G10 counterparts yesterday despite continuing soft US economic data. US industrial production rose +0.6% mom in Sep, but this was largely due to utilities -- manufacturing output rose only +0.1% (vs +0.3% expected and +0.5% previous). Of particular note was a 0.5% drop in production of computer and electronic products, which is important because this component is used to estimate equipment spending in the GDP accounts. To make matters worse, pending home sales plunged 5.6% mom (no change expected), the largest drop in more than three years, as it seems that housing demand was brought forward by expectations of rising rates. On top of which, the Dallas Fed manufacturing activity survey was also far weaker than expected (3.6 vs 10.0 expected, 12.8 previous). Yet there has been a constant pattern recently of USD buying early in the US session, perhaps helped yesterday by weakness in European financial stocks, and the dollar is generally higher this morning as a result.
The dollar buying may represent cautiousness ahead of this week’s FOMC meeting. While no change in policy is expected at the meeting, the fact is that the bulk of the moves in EUR/USD this year have come on FOMC, ECB and US payrolls days. Thus some investors may be positioning themselves in anticipation of a dollar reversal after the FOMC meeting, as indicated by purchases of short-dated USD calls. Probably, some people think that there is only a narrow window of opportunity for the Fed to begin tapering before the negotiations over the US government budget start up again in December and that the FOMC may decide to take a chance rather than miss this opportunity. Personally, I disagree – given the slowdown in hiring recently, I think that if anything the FOMC would be more likely to vote for further quantitative easing at this point than for tapering off its existing QE, although that too seems extremely unlikely.
The dollar scored its largest gains overnight vs AUD after RBA Gov. Stevens said the AUD’s value was not supported by the fundamentals and predicted that the currency would at some point be “materially lower than it is today.” It also gained vs SEK following yesterday’s disappointing Swedish retail sales figures. GBP/USD fell after Bank of England Economic Advisor David Miles said it could be “catastrophic” to raise rates too soon. The exception is USD/JPY, which is slightly lower after better-than-expected Japanese retail sales figures (+1.8% mom vs +0.5% expected).
During the European morning we get UK mortgage approvals for September, which are expected to have increased for a third consecutive month. Later in the day, US retail sales for September excluding autos and gasoline are forecast to be up by 0.5% vs an increase of 0.1% in August. That could help to boost USD further, although as we noted above, yesterday’s weaker-than-expected data did not hurt the dollar. US core producer prices for September are forecast to rise 0.1% mom after having remained unchanged the previous month. We also have the Case/Shiller house price index for August, which is estimated to show a rise of 12.40% yoy, about the same as in August. Finally, the Conference Board consumer confidence index for October is forecast to fall to 75.0 from 79.7 in September, which would surprise no one.
The Market
EUR/USD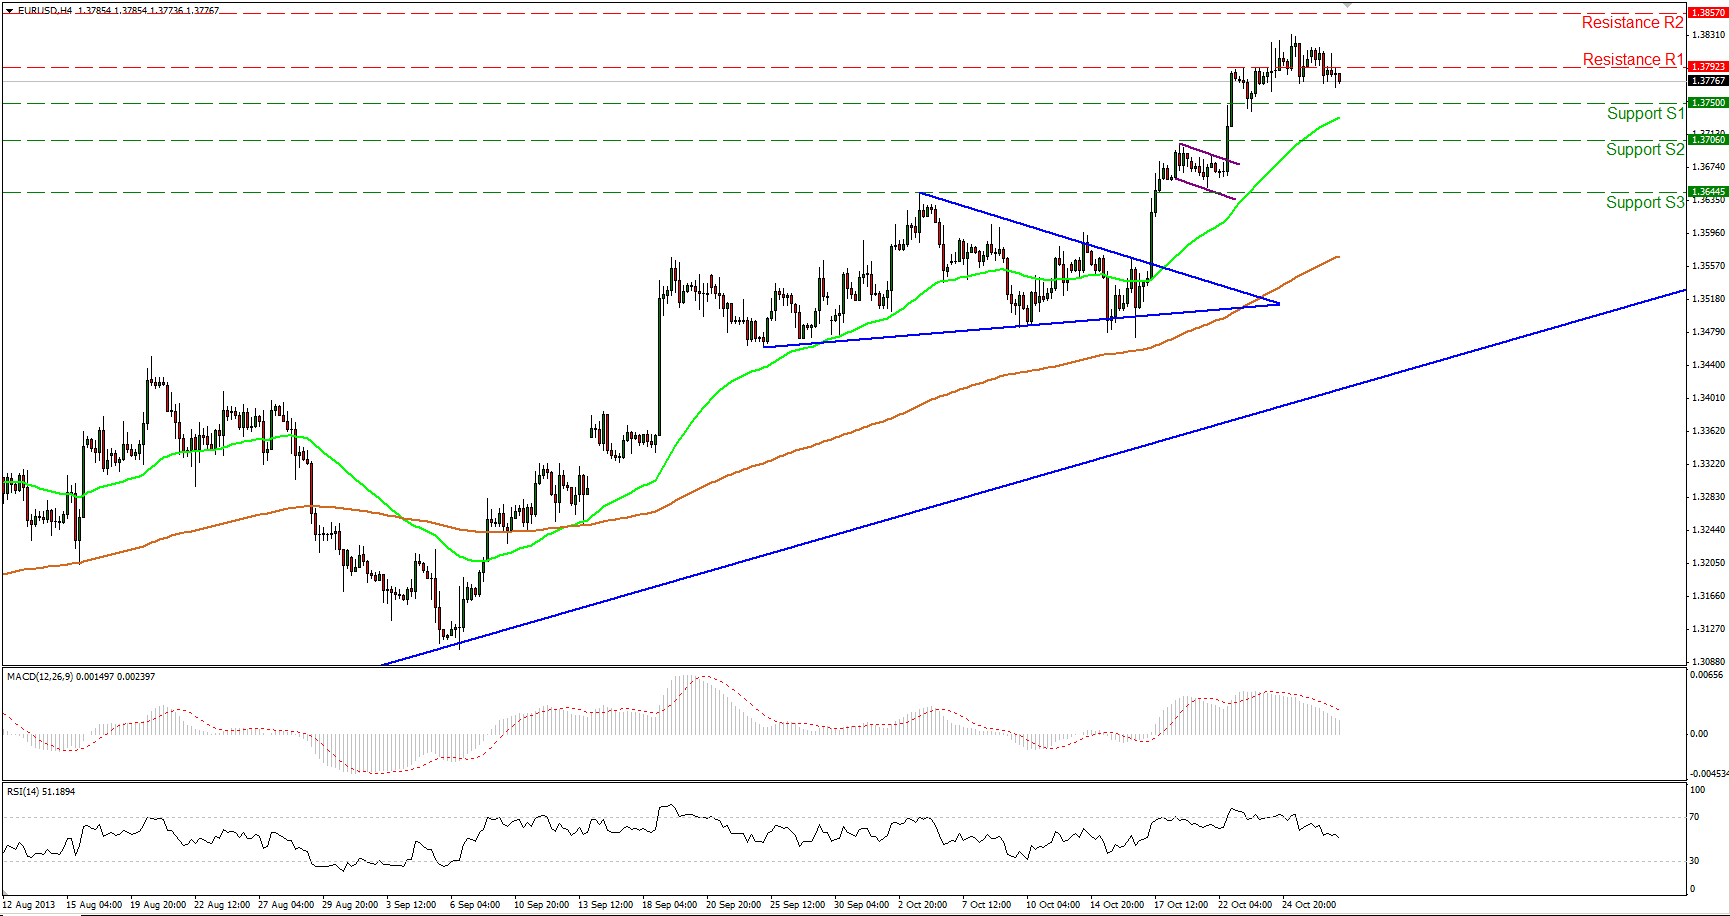 EUR/USD Hourly Chart" title="EUR/USD Hourly Chart" width="1731" height="916">
The EUR/USD moved once again below 1.3800, confirming the inability of the longs to drive the action higher. I would expect the downward wave to continue, maybe to test once more February’s highs at 1.3706 (S2). Both momentum indicators continued their downward path, enhancing the scenario for the continuation of the pullback. However, the rate is still trading above both the moving averages, so I would consider any downward move as a retracement for now. On the daily chart, a long term uptrend remains in effect.
• Support: 1.3750 (S1), 1.3706 (S2), 1.3644 (S3)
• Resistance: 1.3792 (R1), 1.3857 (R2), 1.3935 (R3).
USD/JPY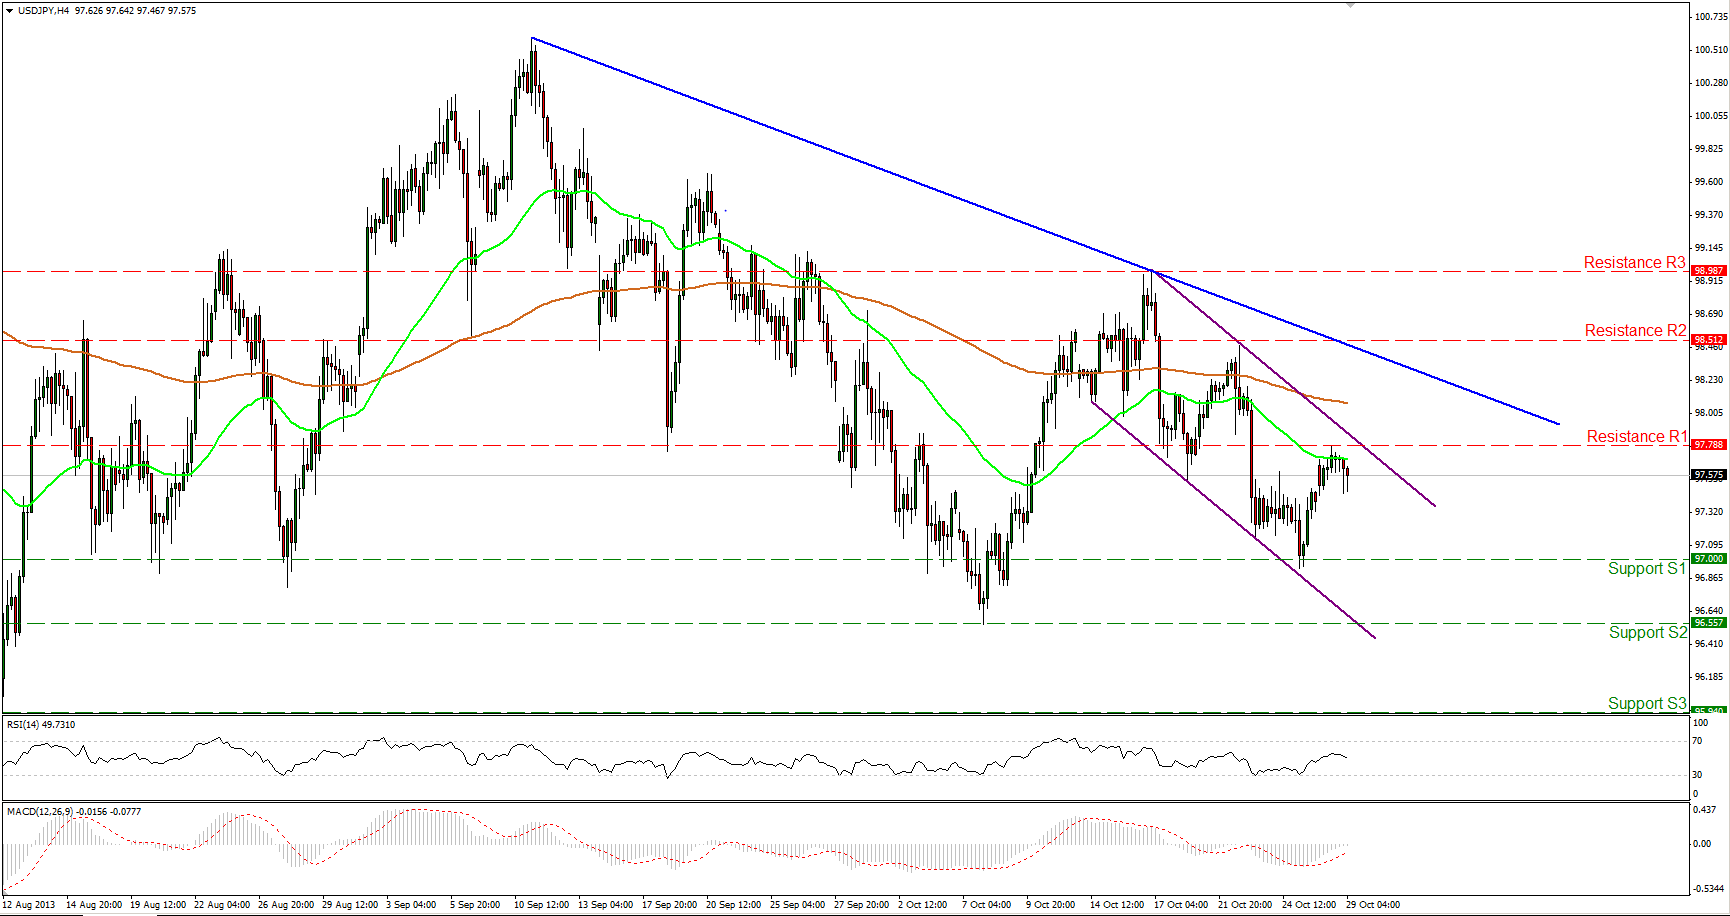 USD/JPY Hourly Chart" title="USD/JPY Hourly Chart" width="1731" height="916">
The USD/JPY confirmed our worries and on Monday rebounded at the 97.00 (S1) key floor. Yesterday the price touched the resistance at 97.78 (R1) and moved slightly lower. In my opinion, the bears might drive the rate further down to test once more the strong support at 97.00 (S1). Both oscillators lie near their neutral levels, not giving any clues for the forthcoming wave. However, the bias for now remains to the downside, since the price is moving within a short-term downward slopping channel.
• Support: 97.00 (S1), 96.55 (S2), 95.94 (S3).
• Resistance: 97.78 (R1), 98.51 (R2), 98.98 (R3).
EUR/GBP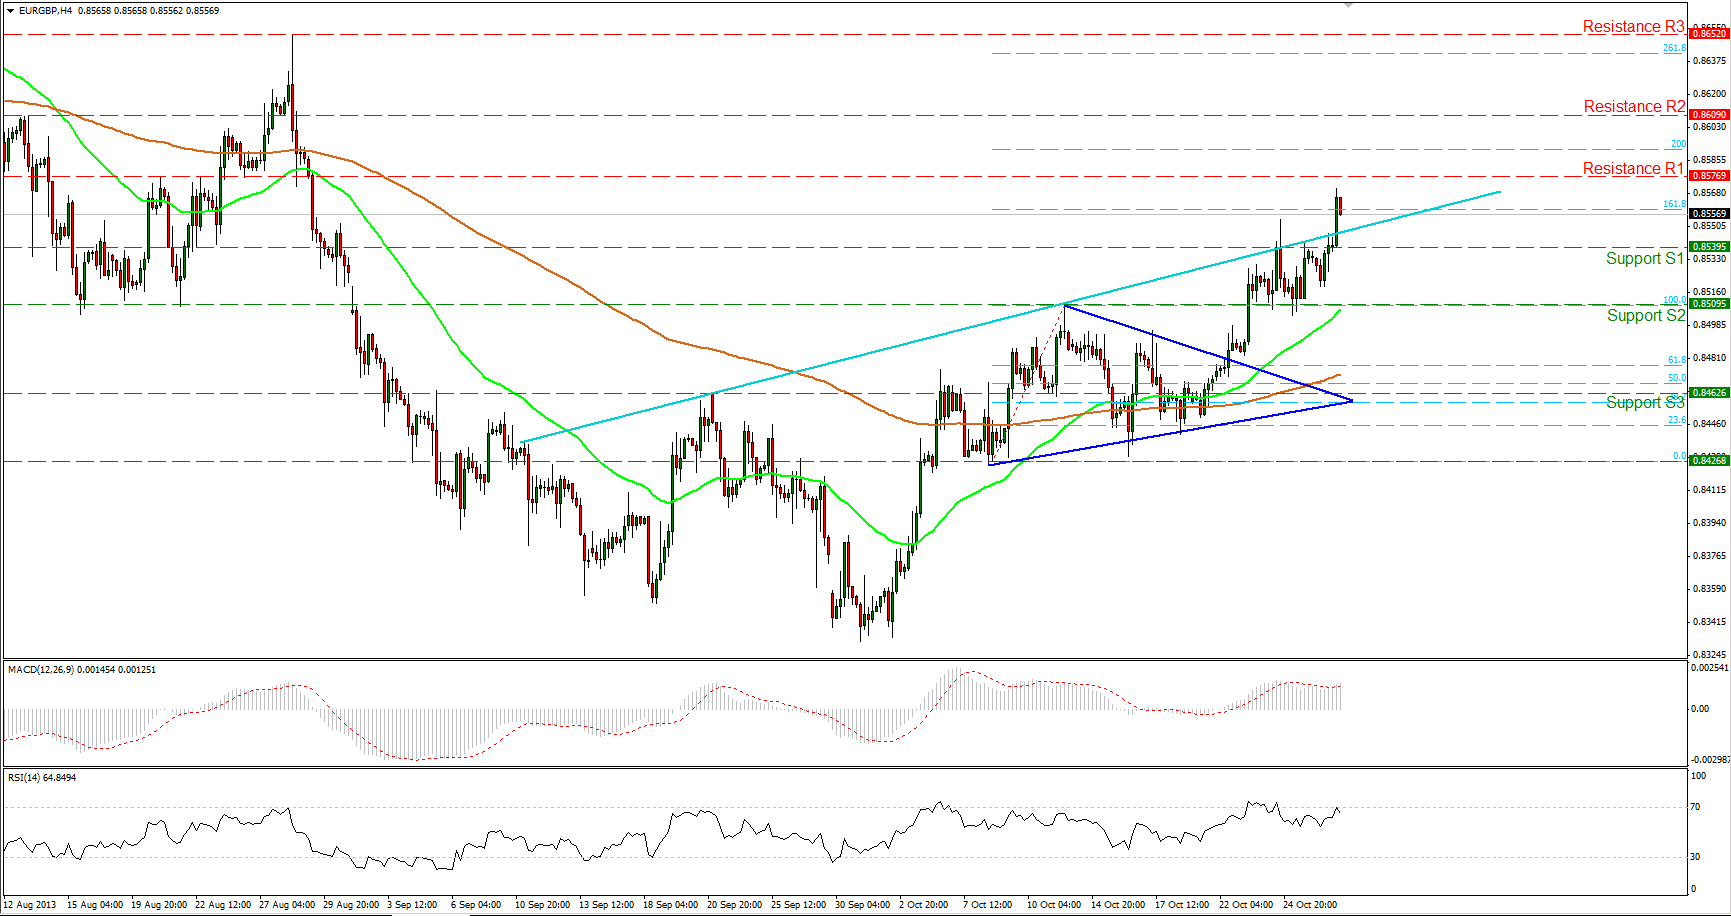 EUR/GBP Hourly Chart" title="EUR/GBP Hourly Chart" width="1731" height="916">
The EUR/GBP moved significantly higher, breaking the light blue neckline of a possible inverse head and shoulders formation and reaching the 161.8% Fibonacci extension target of the triangle’s width. A decisive break above the 0.8577 (R1) resistance would add significance to the validity of the formation. We may see buying pressure driving the rate towards next resistance areas. The picture of the rate remains positive, since the 50-period moving average lies above the 200-period moving average.
• Support: 0.8539 (S1), 0.8509 (S2), 0.8462 (S3).
• Resistance: 0.8577 (R1), 0.8609 (R2) and 0.8652 (R3).
Gold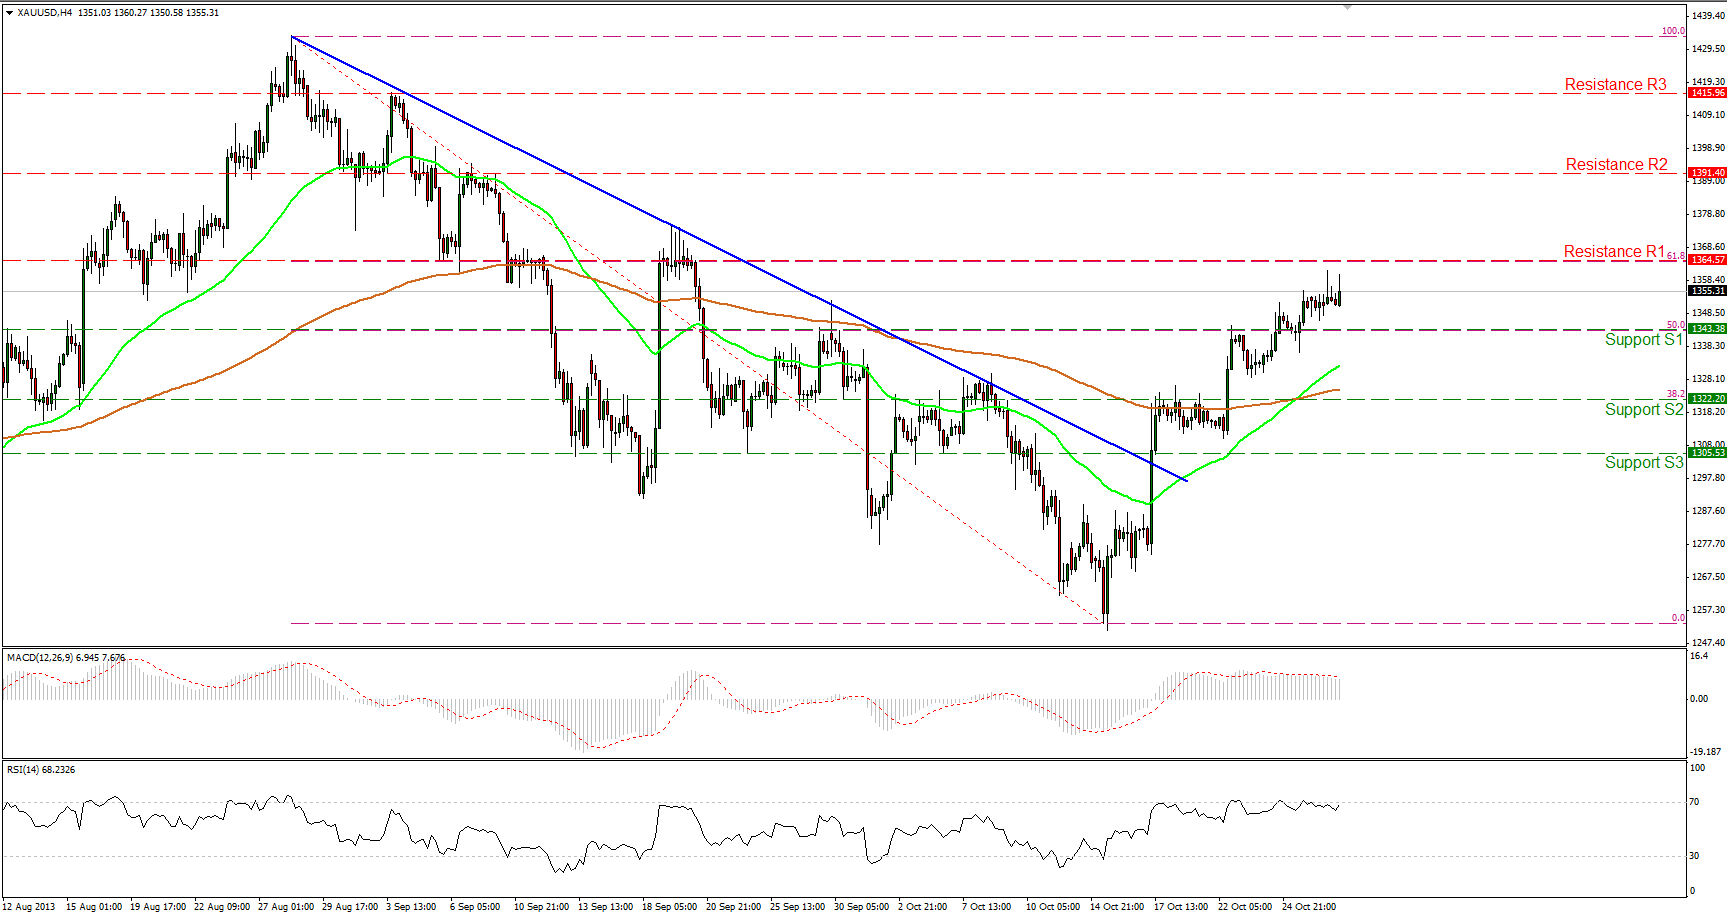 XAU/USD Hourly Chart" title="XAU/USD Hourly Chart" width="1731" height="916">
Gold remained where we left it yesterday, between the 1343 barrier and the resistance of 1364 (R1), which coincides with the 61.8% Fibonacci retracement level of the prior downtrend. If the bulls are strong enough to overcome that hurdle, they would target the next resistance at 1391 (R2). The price is trading above both the moving averages, forming higher highs and higher lows, favoring further upward movement. On the daily chart, the metal is forming a possible inverse head and shoulders pattern, but is not completed yet.
• Support: 1343 (S1), 1322 (S2), 1305 (S3).
• Resistance: 1364 (R1), 1391 (R2), 1415 (R3).
Oil
WTI moved higher and is currently trading between the 97.70 (S1) support and the 99.32 (R1) resistance level. The price remains in a corrective phase, and as long as the wave is within the channel, there is no reason for concern. We would reconsider our analysis upon a violation of the channel’s upper boundary and the 101.00 (R2) key hurdle.
• At present, the overall downtrend remains in effect since WTI is trading within the downward sloping channel and below both moving averages.
• Support: 97.70 (S1), 96.00 (S2), 93.61 (S3).
• Resistance: 99.32 (R1), 101.00 (R2), 102.92 (R3).
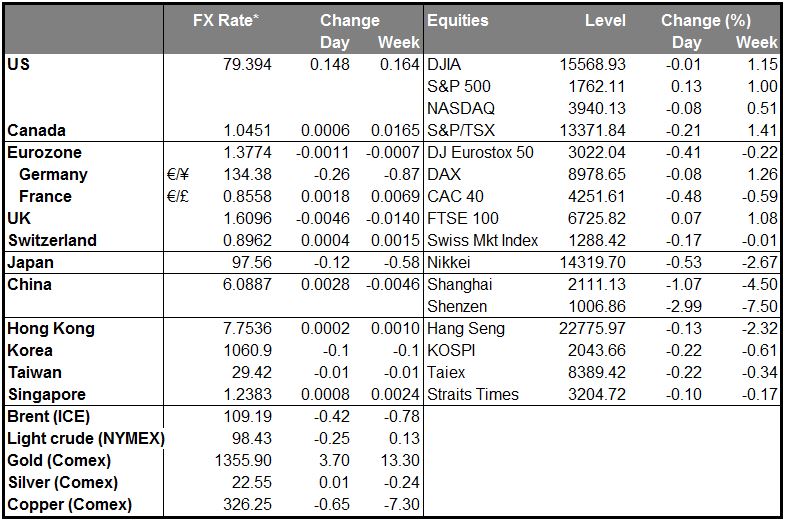
BENCHMARK CURRENCY RATES: DAILY GAINERS AND LOSERS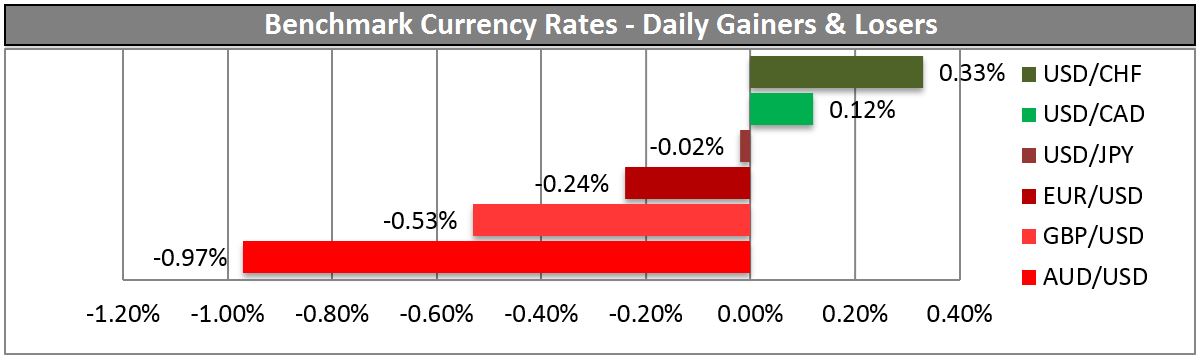
MARKETS SUMMARY