The “dividend aristocrats” are stocks that have increased their dividends every year for at least 25 years. Unsurprisingly, they’re popular among investors looking for a reliable stream of growing income. However, many of these companies regularly pay out more cash than they earn. Ultimately, that’s unsustainable and there will be a day of reckoning.
A little over a century ago, Europe was full of aristocrats that lived in huge houses on grand estates. This kind of high living required massive staffs of servants, to keep the owners living in the styles to which they’d become accustomed.
Then things changed. Expectations and wages rose as education improved, economies continued to industrialize and new political movements gained momentum. Suddenly, those huge estate payrolls became massive burdens.
As their coffers ran dry, many aristocrats found themselves struggling to maintain the inherited estates that defined their status. Land and property were mortgaged to the hilt. Assets - the proverbial “family silver” - were sold off to raise cash and delay the reckoning day.
But that reckoning day came for most of them. Some of the aristocrats still inhabit some cozy corner of their huge country piles. But they usually only achieve it by allowing thousands of paying visitors to traipse around their ancestral homes. The vast banks of agricultural land have long been sold off. The buildings are held in trust for nations, and are no longer private assets.
I believe many of today’s “dividend aristocrats” are on the cusp of a similarly dismal financial future. The Dukes of Dividends and Barons of Buybacks are living on borrowed time...which is to say more and more borrowed money.
Their business empires are being mortgaged or sold off piecemeal to keep the cash flowing to investors...or to insiders. One day, there will be little left. You’d be right to think that’s a big claim. So let’s look at some evidence.
There are 53 stocks in the S&P Dividend Aristocrats index. A great many of them are household names since, by definition, they must have existed for over a quarter of a century.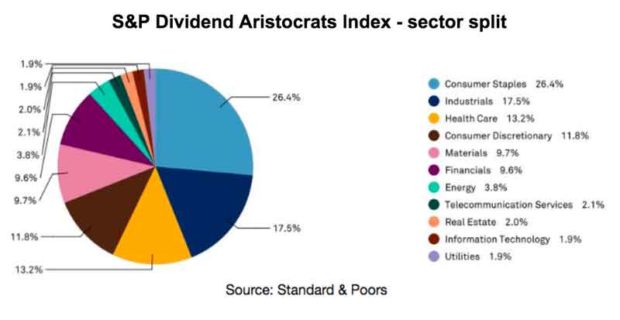
The problem is that these supposedly elite members of stock market society often have some deep-seated problems lurking just behind their public facades. I’m constantly trawling through markets to find the best opportunities. In recent times I’ve noticed a lot of big corporations, especially in the US, that consistently pay out more cash than they earn.
To give some insight into this, I’ve taken a closer look at 10 of the very biggest of these companies, since it would take too long to analyze all 53. My selection includes the largest in the list by current market capitalization, although where there’s already a stock from a particular sector I haven’t included any more from that sector, to maximize variety.
For example, I’ve included Exxon Mobil (NYSE:XOM), with a market capitalization of $344 billion. But I haven’t included Chevron Corporation (NYSE:NYSE:CVX), with a market capitalization of $248 billion, so I don’t have two oil & gas companies on the list.
Here’s the list of 10, in order of market capitalization (largest to smallest):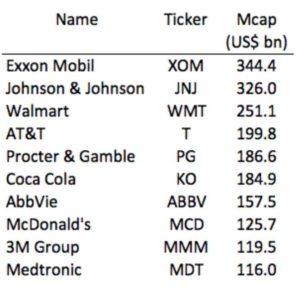
The key to understanding which, if any, of these companies is living within or beyond its means is to compare total cash distributions with free cash flows. Total cash distributions are made up of dividend payments and stock buybacks. Free cash flows consist of operating cash flows - being cash profits from business activities - less capital expenditure - being cash spent on maintaining or increasing business assets.
If cash distributions are consistently higher than free cash flows then the shortfall has to be made up somehow. That can be done by adding debt (“mortgaging the estate”) or by selling assets or whole sub-businesses (“selling off the family silver”). Either way, there’s a limit to how long it can go on.
Dividend payments are stable from year to year, and in the case of these companies we know they always grow (so far). But the amount of stock buybacks can be lumpy from year to year, depending on available resources and management decisions about alternative uses for cash (such as paying off debt or doing a corporate acquisition).
So, to smooth out the lumps and get a more general view of these companies’ financial management, I started by aggregating the relevant figures for the past five years.
I’ve put the detailed figures in a table at the end for those interested. But here’s a chart summarizing the total cash surplus or deficit over the past five years.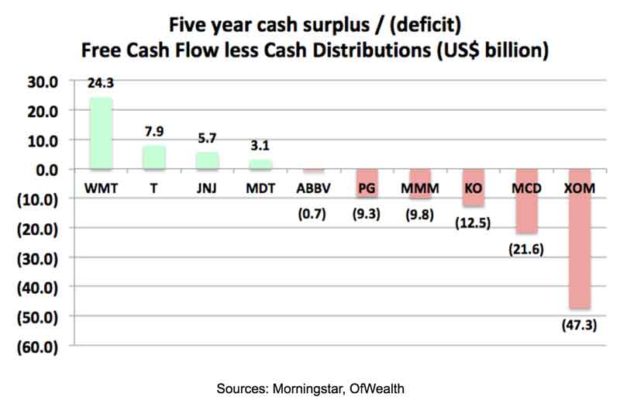
Of this group, it’s clear that four companies have been living within their means and one is on the cusp – ABBV. But five - half the sample - consistently distribute more cash than they have to spare. Walmart (NYSE:WMT) has lived most within its means, whereas Exxon Mobil tops the list of the over-spenders.
If nothing else, this is clear evidence that the honor of being a “dividend aristocrat” is not enough to make a stock a good investment. It’s essential to be selective. There clearly are some great dividend aristocrats. But there are many that are trading on their titles, and not much else.
Each of these companies is a different size and has a different type of business. So it’s important to put those gross cash surpluses and deficits into context. To do that I’ve compared the relationship between the total cash distributions divided by total free cash flows over five years, expressed as a percentage. Anything below 100% means they’ve lived within their means, anything above it means they haven’t.
This next chart shows the results (note the order is different to the previous chart).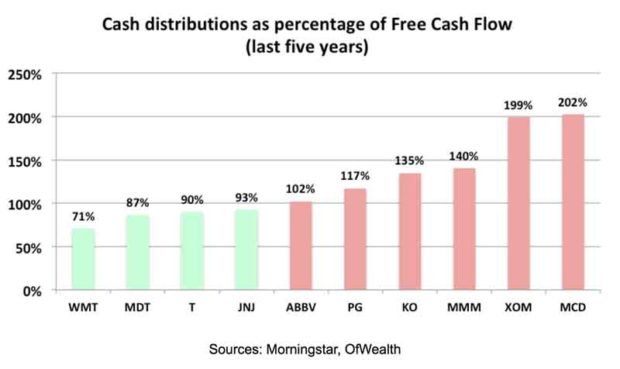
On this view, Walmart (NYSE:WMT) still looks the most prudent. But now, McDonald’s (NYSE:MCD) tops the list of the biggest relative deficits, just pushing Exxon Mobil into second place. The deficit at McDonald’s has largely been funded by adding debt. The company’s debt was $13.6 billion at the end of 2012, but rose to $29.5 billion by the end of 2017. That’s an increase of $15.9 billion over five years, compared with the cash deficit of $21.6 billion.
Here’s another way to look at it. At the end of 2007, McDonald’s debt amounted to 41% of prior year sales. By 2012 that had risen a little, to 49%. But by the end of 2017 the ratio had exploded to 129%. This is a major red flag.
Now, some people might argue that my analysis is unfair because I’m including both dividends and stock buybacks in the cash distributions. But both must be taken into account. That’s because - all things being equal, by which I mean the whole company market capitalization remaining unchanged - cash distributions from dividends and buybacks result in practically the same profit for holders of the stock.
Dividends give income and buybacks result in capital gains, as value is divided between fewer remaining shares. The only significant difference is if the investor has different tax rates for income and capital gains (once realized).
In any case, McDonald’s can at least still cover its dividend payments out of free cash flow. In 2017, the dividends were $3.1 billion whereas free cash flow was $3.7 billion. So if it slashed buybacks from $4.7 billion a year to just $0.7 billion it would be living within its means again. Although, given that the core business is shrinking, investors could pretty much wave goodbye to future capital gains.
Coca-Cola Is Losing Its Fizz
Aside from McDonald’s, there’s at least one company in this list that’s now in an even more stretched position, by which I mean that free cash flow doesn’t even cover the dividends. The name in question is The Coca-Cola Company (NYSE:NYSE:KO), another corporation with growing cash distributions despite a shrinking business. In 2017 it crossed over a dangerous threshold, something that anyone who owns the stock ought to be aware of.
Last year, KO generated free cash flow of $5.3 billion. But it paid dividends of $6.3 billion, already leaving a $1.0 billion deficit. It’s surely a landmark event when a company crosses the proverbial Rubicon of paying a dividend that’s bigger than the cash it can generate.
On top of that, the company spent a further $3.7 billion on stock buybacks, bringing the total cash deficit up to $4.7 billion. It’s perhaps no surprise then that KO also added $4.6 billion to its net debt pile during 2017.
KO has a rapidly shrinking business. Sales fell from $44.3 billion in 2015 to $35.4 billion in 2017...profit before tax dropped from $9.6 billion to $6.7 billion over the same period...operating cash flow was down from $10.5 billion to $7.0 billion...free cash flow fell from $7.9 billion to $5.3 billion.
Despite this, dividends rose from $5.7 billion to $6.3 billion over those two years. Buybacks were relatively unchanged, at $3.6 billion in 2015 and $3.7 billion in 2017, but rose as a percentage of the falling free cash flows.
Incidentally, KO bought 82 million of its own shares in 2017, but 53 million (65%) ended up in the hands of management and employees. Little by little, the assets are being transferred from the estate owners to the servants.
Overall, in just the last two full reporting years, KO’s total cash distributions rose from an already excessive 118% of free cash flow to a staggering 189%. The next chart summarizes the figures.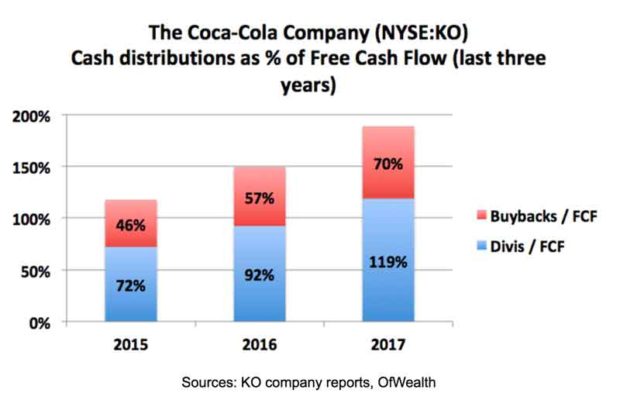
This kind of trajectory is surely unsustainable. Something’s gotta give. Any company with a shrinking or even stagnant business, that keeps increasing its cash distributions - year in, year out - is going to have to add debt or sell off assets at an exponentially increasing rate. Eventually, all that will remain of the once fine country house will be an empty shell with broken windows and a leaking roof.
None of this is to say that there aren’t some really great dividend aristocrats. In fact, I recommended one to members of OfWealth 3D Stock Investor just last week. The company is in great financial shape and the stock is currently under appreciated. It’s raised its dividend for 43 years in a row, but still lives well within its means - even with substantial stock buybacks as well.
In the meantime, I hope I’ve shown enough reasons why investors need to be selective, even in this elite group. Taken alone, the title of “dividend aristocrat” no longer automatically implies high class. In many instances, the once-full estate coffers are rapidly running dry.
Here’s the table with more detail of individual company figures, for those interested.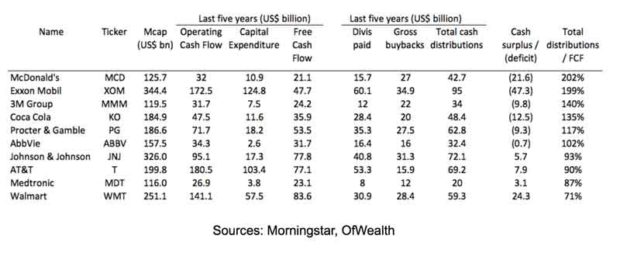
Stay tuned OfWealthers, Rob Marstrand
robmarstrand@ofwealth.com
