The gold price moved up $18. However, the silver price moved up 60 cents, which is a much bigger percentage. The silver community is getting pretty excited.
A market trend will often begin when a small number of traders learn something new. As they begin buying (or selling), the price begins to move. Others become aware of the truth, and they begin buying. There’s just one problem with these moves.
By the time most people hear about it, the fundamentals have changed. Oh, the discovery may still be true, but the new, higher price offers no bargain.
For years, silver has been priced in the market above its fundamental (with a few momentary exceptions, such as one year ago). The fundamental price was way below the market, and led it down.
Then this summer, the market and fundamental inverted as the market price fell. The fundamental caught down to it by July 14. In the last week of August, another inversion occurred. The market price dropped through the fundamental, which was rising by then.
Now the market price has shot up, probably for two reasons. One is the persistent rumors of silver coin shortages that people mistake for a silver bullion shortage. The other is the nonfarm payrolls report, which they interpret as a green light for more quantitative easing. Add to this the fact that the gold price is rising in the face of strong fundamentals, and people buy up silver.
Read on, for the only true picture gold and silver supply and demand fundamentals…
First, here is the graph of the metals’ prices.
The Prices of Gold and Silver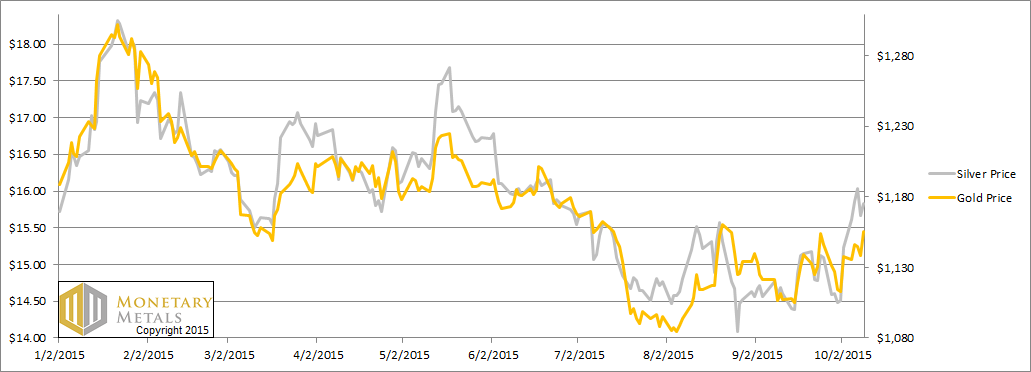
We are interested in the changing equilibrium created when some market participants are accumulating hoards and others are dishoarding. Of course, what makes it exciting is that speculators can (temporarily) exaggerate or fight against the trend. The speculators are often acting on rumors, technical analysis, or partial data about flows into or out of one corner of the market. That kind of information can’t tell them whether the globe, on net, is hoarding or dishoarding.
One could point out that gold does not, on net, go into or out of anything. Yes, that is true. But it can come out of hoards and into carry trades. That is what we study. The gold basis tells us about this dynamic.
Conventional techniques for analyzing supply and demand are inapplicable to gold and silver, because the monetary metals have such high inventories. In normal commodities, inventories divided by annual production (stocks to flows) can be measured in months. The world just does not keep much inventory in wheat or oil.
With gold and silver, stocks to flows is measured in decades. Every ounce of those massive stockpiles is potential supply. Everyone on the planet is potential demand. At the right price, and under the right conditions. Looking at incremental changes in mine output or electronic manufacturing is not helpful to predict the future prices of the metals.
Next, this is a graph of the gold price measured in silver, otherwise known as the gold to silver ratio. The ratio moved down this week.
The Ratio of the Gold Price to the Silver Price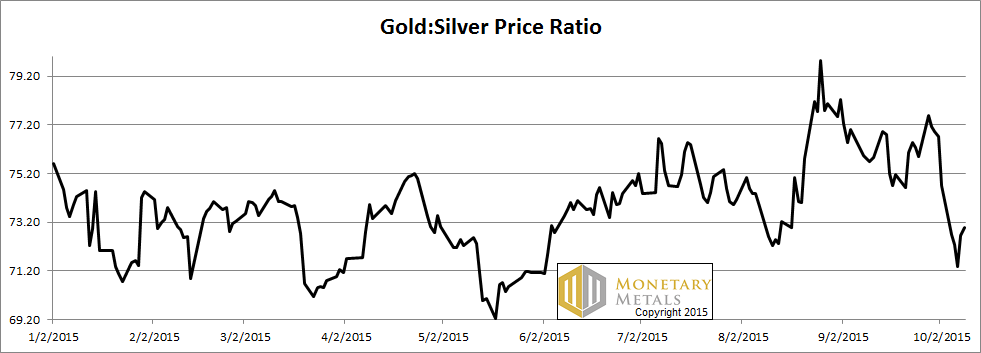
For each metal, we will look at a graph of the basis and cobasis overlaid with the price of the dollar in terms of the respective metal. It will make it easier to provide brief commentary. The dollar will be represented in green, the basis in blue and cobasis in red.
Here is the gold graph.
The Gold Basis and Cobasis and the Dollar Price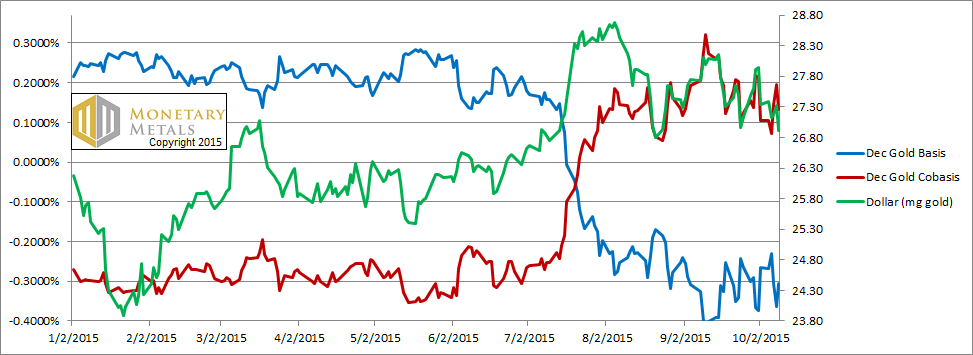
The cobasis (scarcity) is largely tracking the price of the dollar in gold (the inverse of the price of gold in dollars—which is what most people think about).
We have several reasons why we insist on looking at the price of the dollar. One, repeated often in these Reports, is the fact that gold is money. The price of everything should be quoted in terms of money. Uncle Sam’s green paper is not money. It’s, well… it’s Uncle Sam’s credit paper. It, too, should be quoted in terms of money. It is now below 27mg gold, an interesting line in the sand.
There’s another reason. It lets us compare the scarcity of money to the price of the dollar. As the dollar goes up, it’s generally correlated with gold disappearing from the market. Why is that?
There is no way to understand this, without first understanding that gold is money.
Under stress, it is always the bid that withdraws. Never the ask (or offer). Think of a rumor of a financial institution becoming insolvent. There is no lack of offers to sell its stock, but there can be a market condition of no bid.
Gold is gradually withdrawing its bid on the dollar. This has nothing to do with QE, unemployment, CPI, GDP, macroprudential supervision, or any other high-sounding term to come out of the Fed or the mainstream economics profession.
It has to do with the twin dollar pathologies of rising debt and falling interest. These flaws are fatal. They are inexorable, like plate tectonics on Earth. And they will be fatal.
Owners of gold increasingly wonder why they should bid on the dollar. Or, if not, they bid and buy dollars, and the new owner of the gold wonders. And so it goes, like bankruptcy as described by Ernest Hemingway. “Gradually, then suddenly.”
We are in the gradual phase now. If you are wishing for a much higher gold price (i.e. a much lower dollar price), be careful what you wish for. We rather suspect you won’t like the world, when the dollar is 6mg gold.
Now lets look at silver.
The Silver Basis and Cobasis and the Dollar Price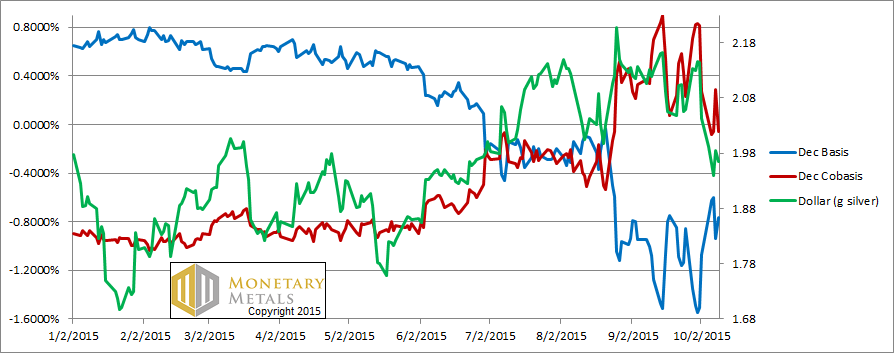
There’s a lot to say about silver this week, and lots to show. First, notice the drop in the cobasis as the dollar dropped in terms of silver.
Lets take a look at the continuous silver basis and cobasis from June through today.
The Continuous Silver Bases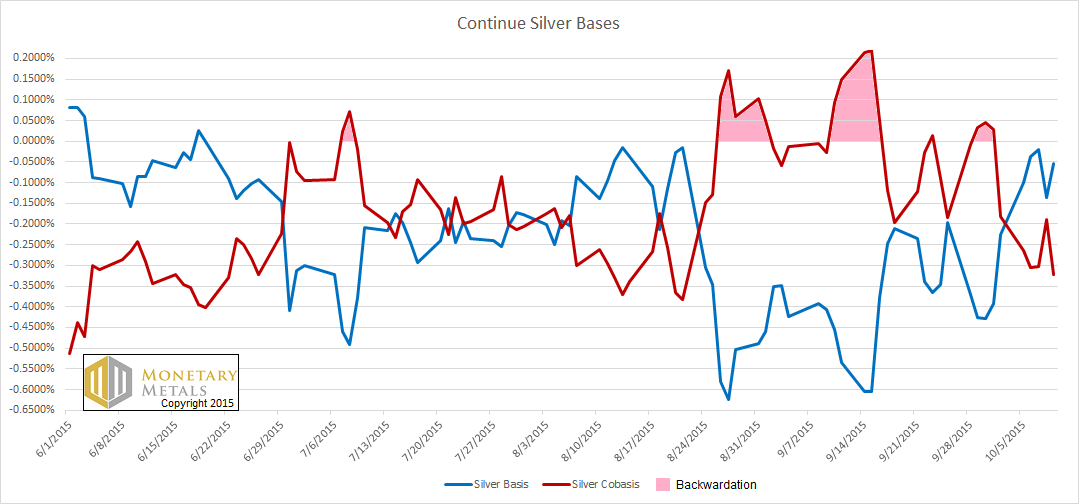
Backwardation has disappeared, almost as quickly as it appeared.
The Market and Fundamental Prices for Silver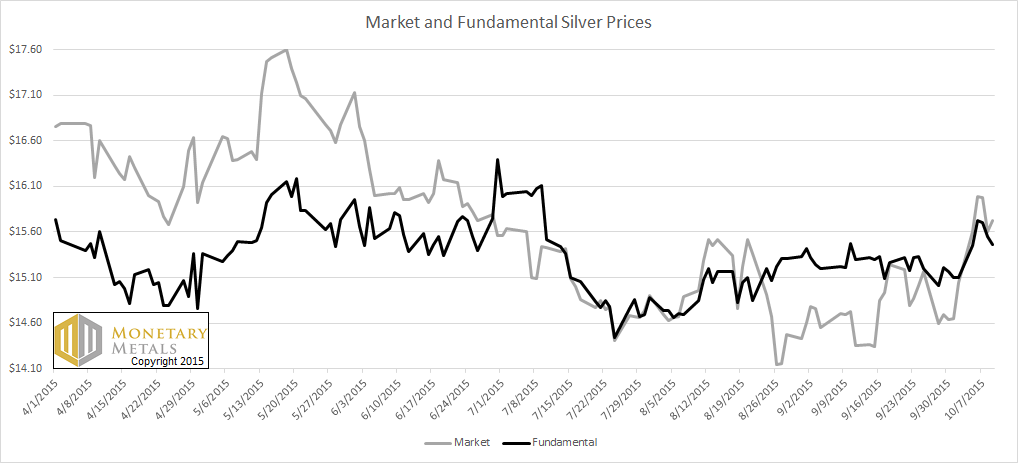
Last week, we said:
By our calculation, the market price of silver is at or above its fundamental.
Now it’s a 30-cent gap.
The fundamental price (shown in black) is much less volatile than the market price. Speculators can be manic depressive, as some great minds have observed for many decades.
Could the market price go up from here? You bet (to choose, perhaps, an unfortunate idiomatic expression). We would almost expect it to if the gold price continues to rise towards its fundamental price (over $100 above the market price).
Would we bet on it? Put it this way. The story of silver shortage (and backwardation) is over. Even the December cobasis fell from near 1% in the middle of last month, to below zero now. It is swimming against the tide, and the post-2008 new normal to fall this close to expiry.
