
The Daily Edge is authored by Ivan Delgado, Head of Market Research at Global Prime. The purpose of this content is to provide an assessment of the market conditions. The report takes an in-depth look of market dynamics, factoring in fundamentals, technicals, inter-market, futures and options, in order to determine daily biases and assist one’s decisions on a regular basis.
Quick Take — Why The USD Bearish Outlook?
The US Dollar is set to extend its weakness against the Euro in the following weeks towards its next projected targets at 1.1550 (hit on the breakout) and ultimately complete its bearish cycle as the currency is dealt at levels circa 1.1750 up to 1.18. In this article, I will lay out all the reasons that have cemented and continue to make me bearish the world’s reserve currency.
Drivers — What’s The Current Story?
The debacle of the US Dollar from its peak in Nov-Dec ’18 can be explained, rather than by the merits of the Euro per se (far from it), which accounts for 57% of the DXY basket, as an adjustment of expectations over the Federal Reserve’s inability to raise rates any further. The most fascinating part about the walk back in the Fed hawkish rhetoric in a matter of weeks, however, is the fact that the market has been the ultimate culprit forcing the Fed to re-think its normalization path, even if the unwillingness by the Fed to hear the screaming market signals amid a roaring economy was clear.
The re-calibration in the language by Fed’s Chairman Powell, now publicly admitting that the Central Bank is finally open to hearing the signals the market is sending by considering potential tweaks in its QT (quantitative tightening) down the road, was the ultimate evidence of a market that was setting up to near a resolution of its protracted range.
In the last 24h, multiple Fed speaks have left no stone unturned, providing further backing to the view that the era of tightening has come to an abrupt halt in the foreseeable future. Fed’s Bostic, Evans, Rosengren, Mester, all seem to now be defending the same camp, one where ‘patience’ and ‘flexibility’ has become the norm. This dovish tilt was further confirmed by the Fed minutes, where the statement read that “the committee could afford to be patient about further policy firming” with risks to the outlook highlighted.
By and large, that’s been the story driving the current weakness seen in the US Dollar. A narrative in which the shift in focus from a clearly hawkish stance in early Q4 ’18 to where we’ve come to be today is quite radical, regardless of whether or not the market has been the culprit forcing them to ‘blink’.
It was precisely the market, via the German vs US bond yield spread, which had been telegraphing for quite some time that the capital flows into the US were set to recede as the yield advantage was rapidly on the retreat. Again, it wasn’t as if the German or the wider Eurozone could carry enough credence to justify higher yields, but it was more to do with a rubber band in the US yields front that had seemingly stretched a bit too far.
From mid-December, it’s when we started to see the real cracks in the German vs the US bond yield spread, which firmed up my bullish conviction to start buying Euros on weakness as the preponderance of evidence mounted.
I must confess that even if my view has been to support the long-side bias all along, I wasn’t that convinced by a breakout of the 1.15 vicinity due to the horrendous set of weakening economic indicators in the Euro area. Even if my endorsement has always orbited around buying at discount vs strength.
Remember, a move in a currency exchange rate, in most cases is predicated by the rates differentials between two countries, with some anomalies possible to affect the pricing of the pair short-term, hence why spotting divergences between the pricing and the spread create genuinely solid opportunities.
The fluctuation in government bond yields is mainly a function of two scenarios. It can be based on interest rate expectations or driven by what’s often referred to as a ‘flight to safety’. In the case of the EUR/USD rise, the rise comes as a combination of a Central Bank that hints its bond won’t be yielding at similarly elevated levels in the foreseeable future, and a recent resurgence in risk appetite orchestrated by the Fed Put and the constructive Sino-US talks on trade, which leads to risk appetite flows to also cap the appeal for USDs.
Economic Data Plays Secondary Role vs Yields
It’s important that we continue to observe the rise in the Euro vs US Dollar exchange rate as a function of US Dollar weakness. One of the reasons that the outlook for the Euro is far from promising, hence, it can’t justify much higher levels on its own right is the appalling economic data coming out of the Eurozone, which calls for a recession in Germany during H2. Judge by yourself in the following heatmap of the Eurozone economic indicators.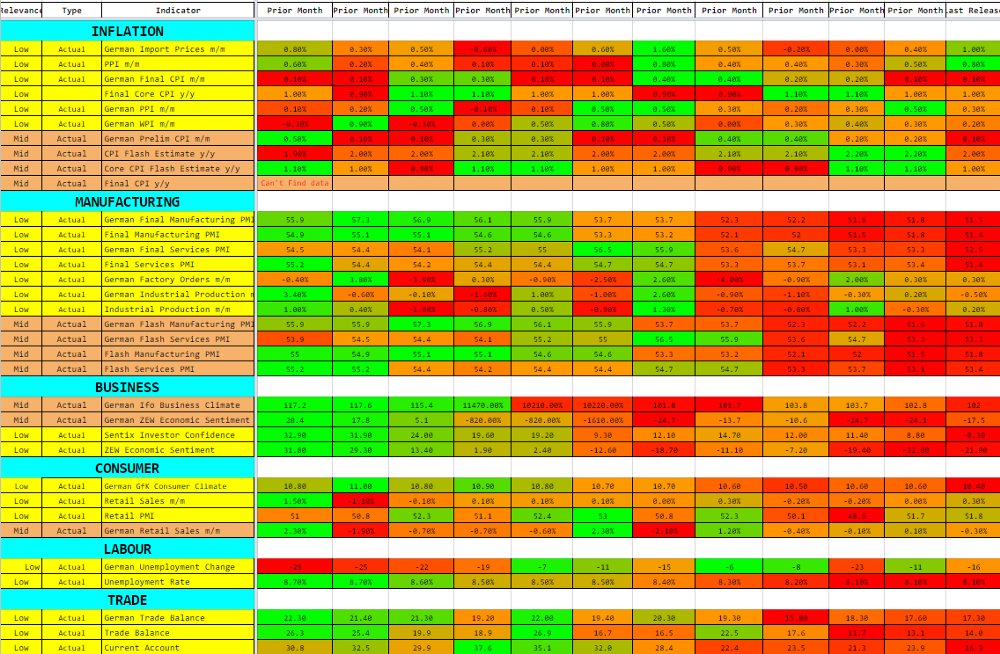
source: GlobalPrime, Forexfactory
The constant flattening of the German yield curve, where the short-end duration pays a higher yield than the long-end, something that has become a global phenomenon as global growth estimates fall rapidly, was a clear reminder that in the Euro area, the expectations for the ECB to keep up its promises of an eventual normalization in 2019 look in shaky grounds. But again, this appreciation in the rate is not a Euro strength story.
In the US, the economic data, up until the miss of the US ISM manufacturing PMI, had been overwhelmingly solid, even if some concern were emerging out of the housing data. In the grand scheme of things, labor and consumption figures keep suggesting that the economy is running at full capacity and that the path of least resistance for the Fed was to keep normalizing.
However, ever since the dramatic turn of events in risk conditions in Q4, the Fed had become increasingly subject to determine its policy-setting away from a purely fundamental-driven model to instead account for the tightening of financial conditions, essentially on dependence mode to the deterioration in market sentiment. This resulted in a snowball effect, culminating in the Fed forced to cave in to the demands or signals if you’d like, emanating from the US yield curve and its deep flattening run, the spike in credit spreads, the incessant sell-off of US equities (worst December since 1931), etc.
Broad-Based Evidence US Dollar A Sell On Strength
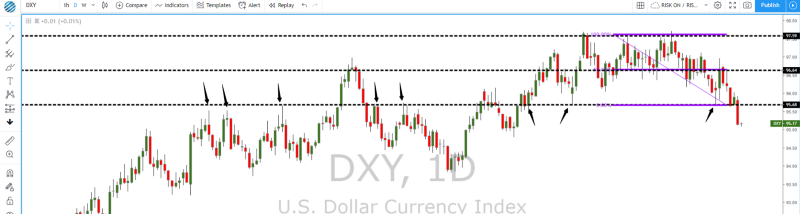
By analyzing the price action in the DXY, we can clearly start to understand why the movement seen in the last 24h carries a degree of significance unlike recent technical developments. If you, like me, pay attention to high-interest areas by the number of times the level has come to interact with price, then you’ll probably agree that a breakout of 95.70 in the DXY or 1.15 in the Euro vs US Dollar was always going to be a make or break point to monitor.
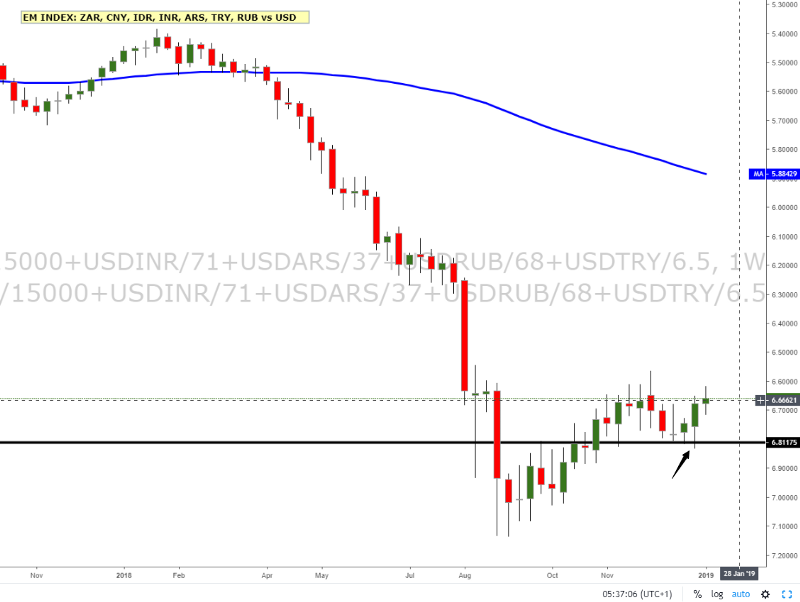
Paying attention to emerging markets FX also cements an analogous outlook, characteristic by the fragility of the USD, best represented by the bullish outside week candle printed in our EM FX chart on the back of the Fed’s Put. Capital keeps flowing away from USD-denominated assets and into the enhanced allure of emerging currencies on the assertiveness that QT is no longer on ‘auto-pilot’ and while the US-Sino trade rhetoric improves.
Below, the Euro vs US Dollar reveals more clues that you probably may be aware of, so let’s break down all the clues we can obtain. Firstly, if we were to draw a volume profile that captures the entire length of the range seen, you will notice how the 70% value area was concentrated in a 1 cent box between 1.1330 and 1.1430/40 (slight adjustment to align it with closes). This allows us to draw an internal range. Similarly, we can draw the borders of the recently broken range at the extremes of the volume tapering, with the sell-off through Nov 12 shrugged off given the subsequential double bottom found at the 1.1270 vicinity, suggestive of fair value creeping up. Therefore, the external range could be taken from the mentioned low end up to 1.15.
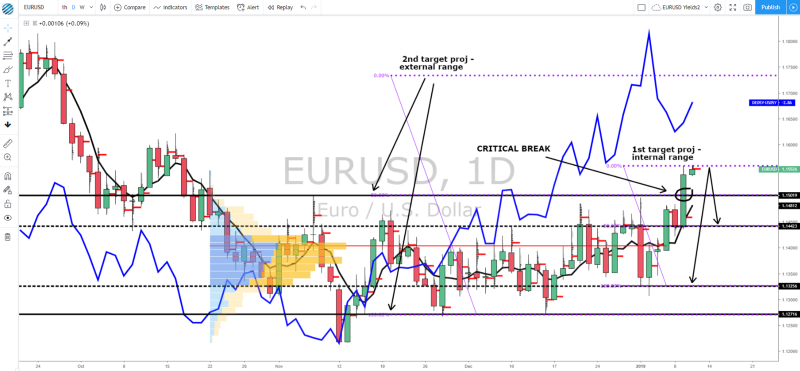
Why is that important, you may be asking? Firstly, because it allows us to tap into the power of market symmetry to anticipate the next macro target, which should be found at the 100% projection target based on an external range size of about 230 pips. In other words, I am looking circa 1.1730–50 as the area where the current buy-side campaign should mature. However, like any hypothesis, we need to ask ourselves, is this thesis a valid one? If you notice, the first breakout has landed to the pip to the first target of 1.1560, which strengthens the notion of the idea playing out as anticipated.
We can also see observe how the movement in the Euro aligns with both the macro and micro divergence between the German vs US bond yield spread and the pricing of the pair. We can crosscheck the fair value of the EUR/USD from a yield spread perspective by re-anchoring where the pair was trading the last time the bond yield spread was dealt at these levels. This results in a target of around 1.18, although one must bear in mind its dynamic essence, as it depends on the ever-evolving spread. However, as a rough estimate, this target does convey an objective message to justify higher levels from here.
Given that the pair has achieved two consecutive impulsive runs away from its saturated range, we can also ask ourselves a sensible question. At what point would the bullish scenario be negated? The answer here, again, can be found by extracting the information from our risk profile diagram. Notice, the area around 1.14 acted as the most heavily traded level during the span of the range? It’s therefore logical to think that any acceptance sub the mentioned round number would imply a failure back towards the old range dynamics.