Get 40% Off
🤯 Perficient is up a mind-blowing 53%. Our ProPicks AI saw the buying opportunity in March.Read full update

The Bulls Took Over The Reins, Again

Published 05/25/2020, 08:20 AM

Stocks versus key resistances - that' how much of last week's trading could be characterized. Yet the bullish bias has been easily noticeable as prices kept making higher highs and higher lows on a daily basis. As a cherry on Friday's trading cake, the S&P 500 predictably shook off the Hong Kong-driven rise in US-China tensions. Will stocks confirm our analysis and break above the upper border of March's gap and the 61.8% Fibonacci retracement shortly?

Judging by the case we lay out next, it's probable.

S&P 500 in the Medium- and Short-Run

We'll start this week's flagship Stock Trading Alert with the weekly chart (charts courtesy of http://stockcharts.com ):
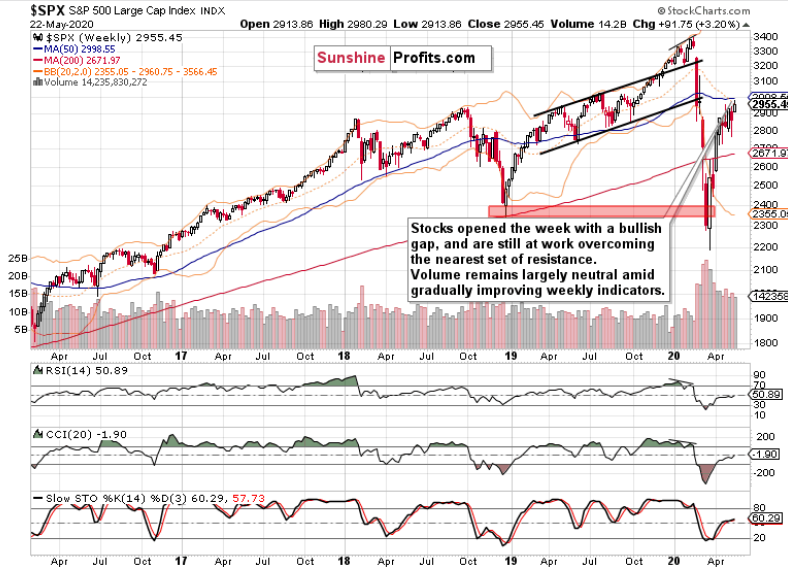
SPX Weekly Chart

After last week's attempt to reverse to the downside, stocks continued to reject lower prices in Monday's premarket session, resulting in a bullish opening gap. And the S&P 500 hasn't really looked back since, moving two steps ahead, one step backward throughout the week.

Knocking on the two key resistances reinforcing each other, it still managed to overcome the lower one, the 61.8% Fibonacci retracement. For how long will the upper one, the early March bearish gap stand?

While the weekly volume was largely neutral in its implications, the indicators don't stand in the way of further gains - but as they're not trending strongly either, we'll have to look for more clues on the daily chart.
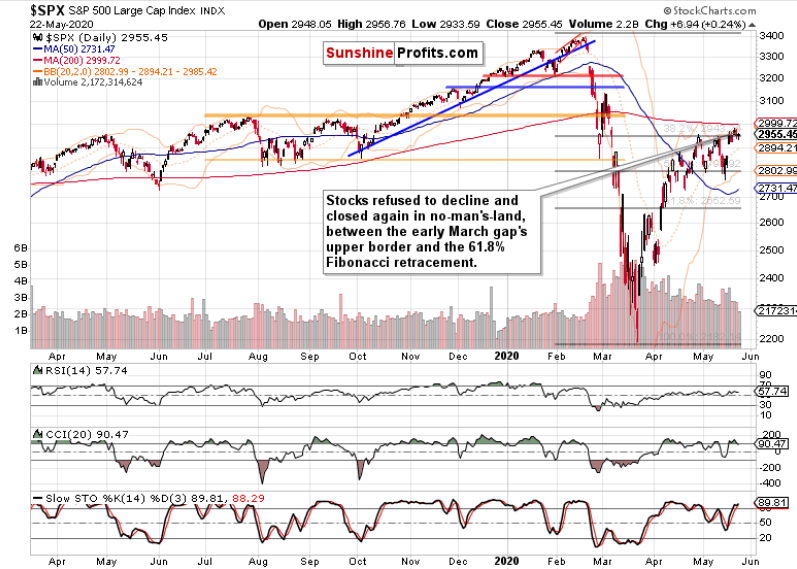
SPX - Daily Chart

The daily chart clearly shows stocks cutting into the combined resistance posed by the early March gap and the 61.8% Fibonacci retracement. Friday's upswing means that the index finished the week back above the latter one.

3rd party Ad. Not an offer or recommendation by Investing.com. See disclosure here or remove ads .

This is what we've written in our Friday's Alert:

(...) this week's daily downswings were only able to achieve higher lows. It means that it's two steps forward, one step backwards for the stock bulls.

Apart from the Hong Kong jitters, there hasn't been any other catalyst or development that would prompt the markets to reassess the risks. While it's true that there needn't be a catalyst, the overnight move lower appears of limited shelf life. Flash in the pan, in other words. The chart posture remains bullish, and we see it likely that the buyers would take on the 200-day moving average (that's around 3000) before too long.

Yesterday's volume doesn't mark a reversal either, and the daily indicators keep supporting the unfolding upleg. When will more buyers jump onboard? Once they do, we expect FOMO (fear of missing out) to become dominant over the wait-and-see approach of this extended consolidation.

Yes, it proved to be a consolidation, because no matter how bearish or bullish the indications for a move either way, stocks kept frustrating both the buyers and sellers equally. As a rollover to the downside never came, the chart pressure to move higher keeps building with each passing day and week, in our opinion.

Friday's higher close happened on lower volume and didn't affect the daily indicators greatly. Regardless, price risks continue being skewed to the upside.

Would the credit markets confirm our bullish take on stocks?

The Credit Markets' Point of View
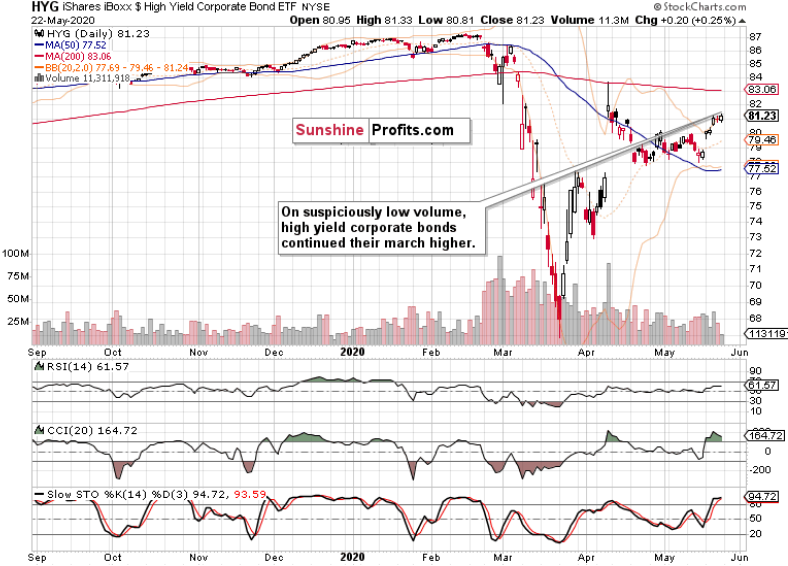
HYG Daily Chart

High yield corporate debt (HYG ETF) moved higher yesterday, but the daily volume is no reason to celebrate. Consolidation of recent sharp gains wouldn't come as a surprise, but this leading metric of credit market health is still primed to go higher and serve as a tailwind for stocks.
3rd party Ad. Not an offer or recommendation by Investing.com. See disclosure here or remove ads .

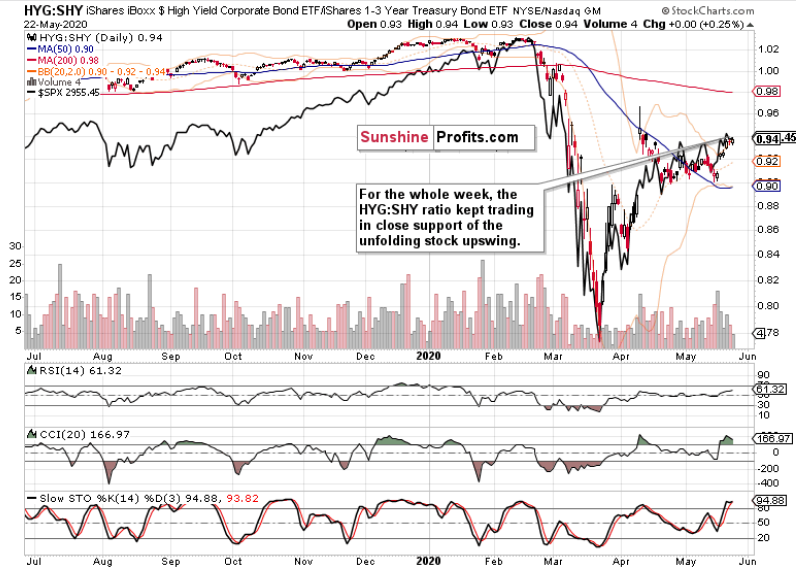
HYG/SHY Daily Chart

The moves in stocks and the high yield corporate bonds to short-term Treasuries ratio (HYG:SHY) continue to be moving in lockstep. Crucially for the stock bulls, this gauge of bullish spirits remains on their side.
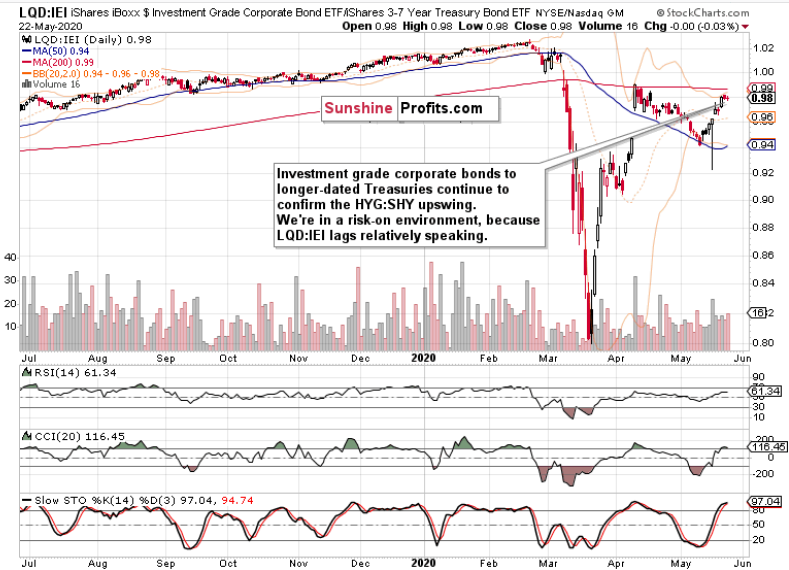
LQD IEI Daily Chart

The same can be said about the ratio of investment-grade corporate bonds to long-dated Treasuries (LQD:IEI). There is no divergence when compared to the previous HYG:SHY ratio.
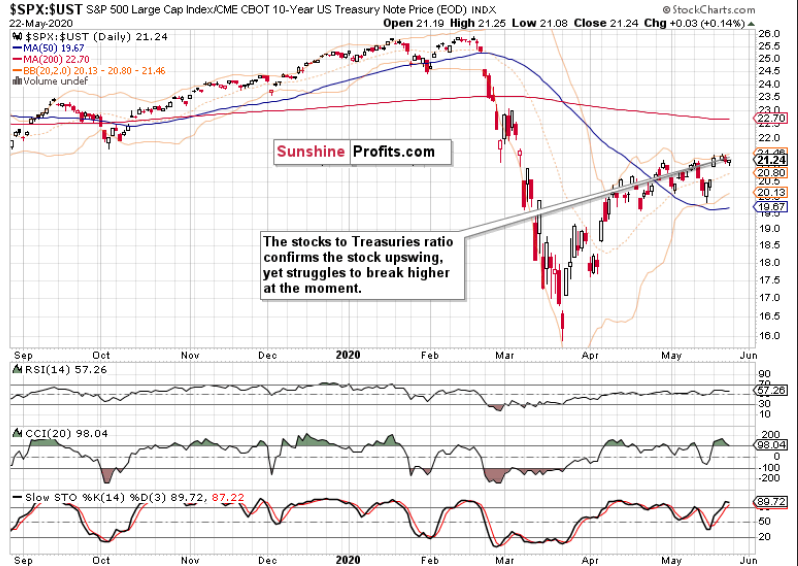
SPX/UST Daily Chart

The ratio of stocks to Treasuries, the S&P 500 to 10-year Treasuries ratio (SPX:UST), paints the struggle of stocks to break higher. As it continues to trade within sight of recent highs amid still bullish indicators, it favors another S&P 500 upswing.

Key S&P 500 Sectors and Ratios in Focus

These were the thoughts we posted in the intraday Stock Trading Alert less than two hours before Friday's session close:

(...) While the S&P 500 didn't make much progress so far, it's the performance of high yield corporate bonds that supports more gains downs the road - and it doesn't all that much matter whether they come still today, or whether stocks catch up vigorously during Monday's premarket session / just thereafter.

The key development among the heavyweight sectors (tech, healthcare and financials) is that they're refusing to budge and decline today.

Let's examine their performance looking at the closing prices.
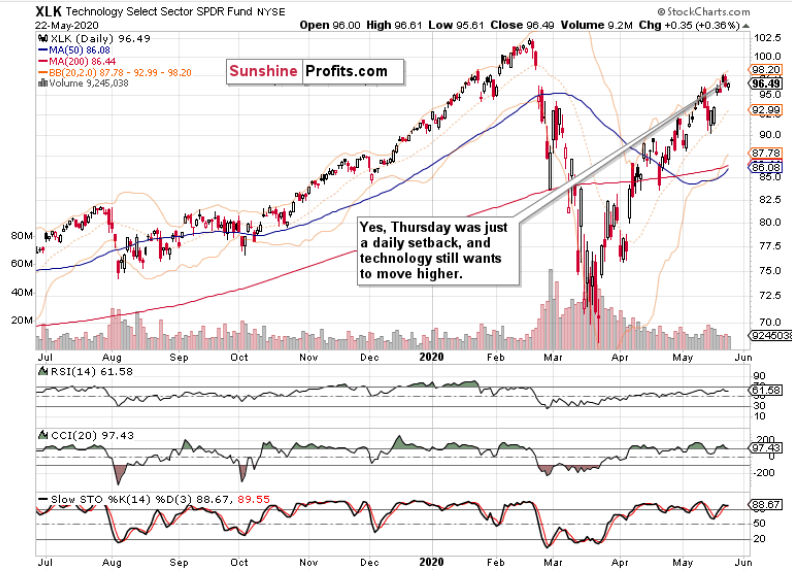
XLK Daily Chart

Indeed, technology (XLK ETF) refused to move lower, validating our earlier thoughts. It appears that a shallow correction is all there has been to it, and that the uptrend can go on and close the late February gap as it would challenge the February highs next.
3rd party Ad. Not an offer or recommendation by Investing.com. See disclosure here or remove ads .

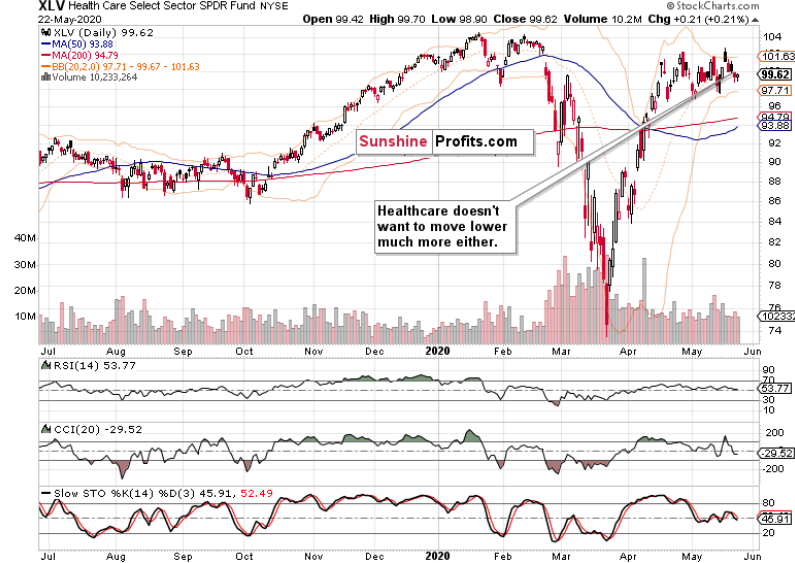
XLV Daily Chart

Healthcare (XLV ETF) also refused to sell off any deeper. Given the swing structure seen, we expect the sector to eventually break higher from its sideways trading range.
XLF Daily Chart

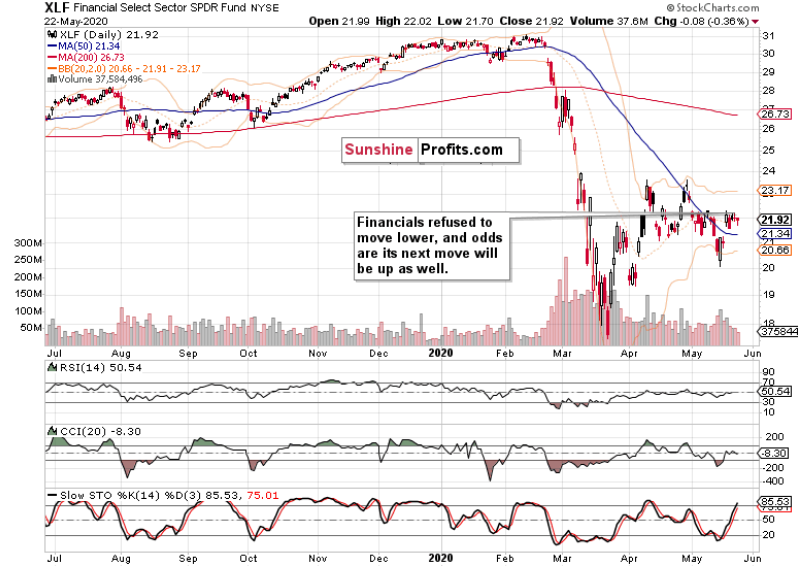
While the HYG ETF closed higher on Friday, financials (XLF ETF) merely refused to decline. Given the posture of the daily indicators and the low volume of Friday's trading, that's no cause for concern - while more sideways trading can go on in the short term, the sector remains likely to challenge its April highs and overcome them.

Once again, consumer discretionaries (XLY ETF) refused to move lower while the consumer staples (XLP ETF) slightly gained. However, the consumer discretionaries to staples ratio (XLY:XLP) continue to trade within spitting distance to its recent highs. These were our Thursday's thoughts about the move's importance as the ratio:

(...) is already trading well above its February highs. Given the degree of real economy destruction seen around, that's quite a signal this leading indicator is sending. The financials to utilities ratio (XLF:XLU) looks to have stabilized not too far from the declining resistance line connecting its mid-March and early-May intraday tops, and it's our opinion that it would go on to break higher.

The XLF:XLU ratio erased its intraday decline on Friday, and continues to trade sideways for now. While it didn't break above the declining resistance line yet, we expect it to overcome it eventually.

As for the stealth bull market trio, all three - energy (XLE ETF), materials (XLB ETF) and industrials (XLI ETF) - refused to decline any more intraday. And the sellers weren't really on the trading floor as it didn't take much buying power to rebuff the meek attempt. While that's a bullish sign in general, let's explore specifically sector-by-sector.
3rd party Ad. Not an offer or recommendation by Investing.com. See disclosure here or remove ads .

XLE Daily Chart

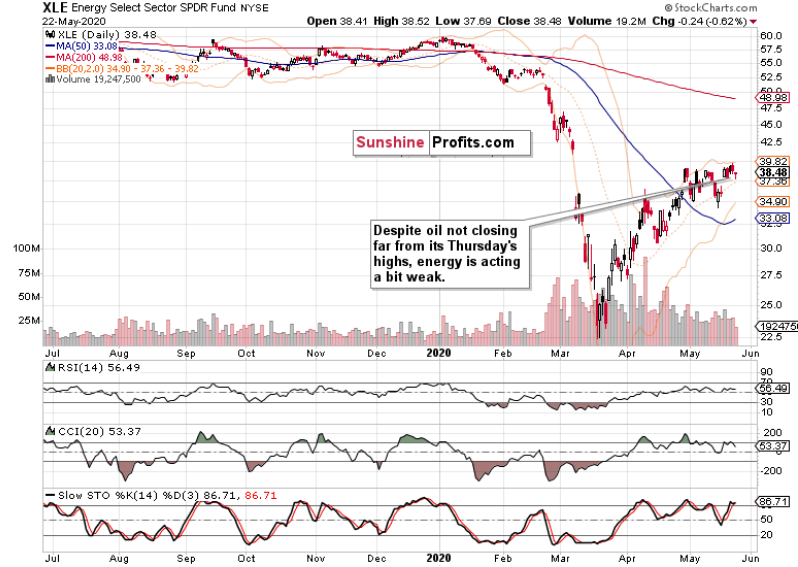
Looking at the closing prices only, energy suffered a daily setback. But it is far from rolling over to the downside, and we expect it to keep on consolidating with a bullish bias.
XLB Daily Chart

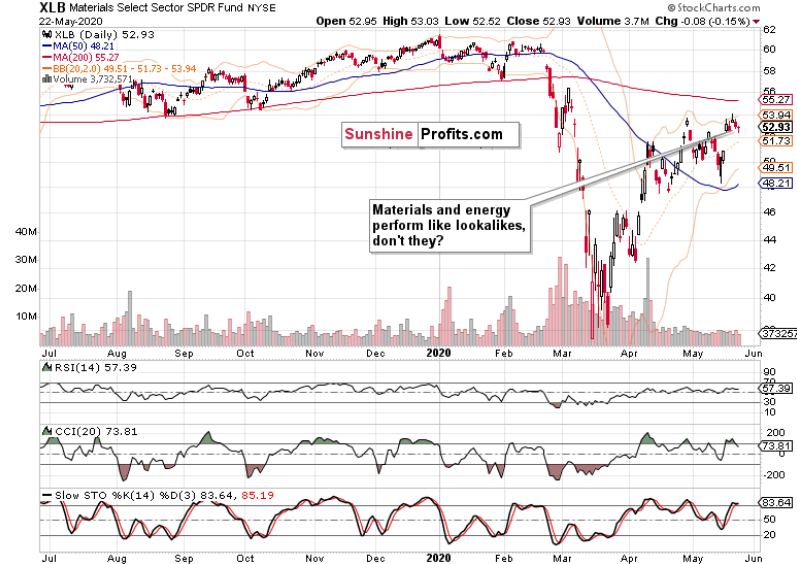
The materials' chart is in a stronger technical posture, having come closer to its all-time highs, and having closed the early March gap already. It certainly appears more gains are on the horizon - especially considering the low volume of Friday's downswing.
XLI Daily Chart

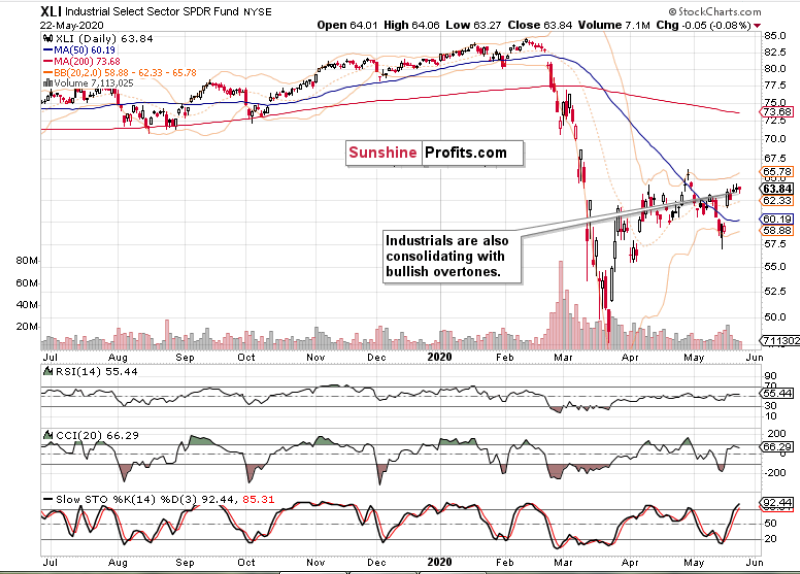
It's also among the industrials that we see base building for an eventual launch higher. Yes, that keeps being true despite the lower low made recently in this sector, or retesting it in materials - an overshoot can come before the market moves in its true direction. And just as with the S&P 500 breaking below the 50% Fibonacci retracement not too long ago, we see that in the stealth bull trio too.

Summary

Summing up, Thursday's decline didn't land in good company of Friday as stocks refused to decline, and actually reverted back above the 61.8% Fibonacci retracement. Another attempt to close the early March gap is supported by the daily indicators, and we expect stocks to break above both formidable resistances on a lasting basis. Both the credit market and sectoral strength examination favor this conclusion. Thereafter, the bulls would target the 200-day moving average at around 3000. That's for starters, as we expect to slowly grind higher overall despite the high likelihood of sideways-to-slightly-down trading over the summer. But before that, the ball remains in the bulls' court.

3rd party Ad. Not an offer or recommendation by Investing.com. See disclosure here or remove ads .

Latest comments

Well thought out - fantastic analysis.  Actionable - I've made money already! Thanks for your contributions, Monica!
I have been doing the opposite of what Monica writes and making money. I am sure it's just me.
I've been riding the profitable bull since the retest of the breakout above the 61.8% Fibonacci resistance. The intraday downswings (microrotations) didn't offer that a juicy opportunity (opportunities) to profit on the short side, especially since I'm in an open 85+point profit and counting ;)
Do not jump into any stock buying frenzy. The current stock market price increases are synthetic and not based on real value creation (US Fed, hype, insiders driving prices up). If you are a retail investor be cautious else you might be left holding the bag.
very well thought out
Thank you!
Ya, The charts dont lie and the fundamentals are starting to make more sense for a bull market 100%. Except who the H EC K is going to pay the bills of the 38.5 million americans without work?? The fed is doing this. they pump the bond market and hyg etf to inflate p/e in stocks. This is going to cripple us. Fomo? I have fomo that i cant get any person to see the reality in the mess our government is causing. Get out of here with that fomo b to the s retail investors dont swing trade. And they will get wrecked here.
I’m just glad my investments during this pandemic has made 50 percent interest
Thanks alot found him
Haha same guy i consult with . Great and honest guy . Made 40% profit off my invested capital in less than a month.
Username???
If you are calling the fed bulls, you are spot on!
We all talk about QE easing (pump). What about QE tightening as conditions dont improve bc we wont allow zombie companies to be wiped out. It distorts and decouples and ultimately robs opportunity for retail investors to get in on bottom floor bc we have to protect the boomers 401k. Complete sham if ask me. But volatility provides swing trade opp.
no one "robs" anyone. It's the market and everyone has a sell button and a buy button. You lose money, your fault. You miss out, your fault too. You will never make money when you think market is out there to ***you. The market is the market. You got two buttons like everyone else does.
As long as the stock exchange is the place where supply and demand forms the "right" price of all player with an equal risk you are right. But ... when one player, the FED, has "all options" and no equal risk, you'r definitely wrong
Understand you are presenting a bullish case based on price action, but readers who may not be aware that many of the gap ups occurred overnight, You had OPEX, VIX rollover, not to mention Fed speaking everyday. I appreciate your analysis, but would like to see a balanced view that reports weak internals, participation, forward PE before Covid at 23, so its likely 40+, I’ll take this article as a Swing trade perspective.
The last market-moving Fed speech dated back to last weekend really and before that, it was the Peterson Institute webinar with Powell and the two governors the day before. VIX is making lower highs and lower lows so far (yes, it can move below the early May lows, and isn't really in an upswing these weeks - just sideways consolidation). As for earnings, stocks looked farther back in 2009 too - they can bridge more than one bad quarter.The investment public to a certain extent missed on that rebound too...
Yes, my focus is swing trading but I am not hesitant to stay longer in favorable conditions or jump out early should they drastically deteriorate.
Does anyone really believe we are sunk..rhetorical question.. but I believe depression and gloom has set in among those inclined to do so. yet the market is saying now..we are good, and going to get better. I believe it is a process to move towards confidence..confidence that the American way of life is the best, and American business is amped to move forward into greater prosperity. Faith is said to be by some to be in believing in the impossible..ha..not for the USA.
Thinking broadly and with my mind away from the markets for a moment, I'm giving you a thumbs-up for the faith in new tomorrow and overcoming setbacks - so true in the markets or wherever else!
the bigger the pump, the bigger the dump. Keep it going while I dollar cost average on my shorts...wooohooo
I'm not happy with the dates and the lack thereof inside the article because not being sure about the dates causes confusion. Today, Monday May 25th, the USA markets are closed for Memorial Day. The article is dated 'By Sunshine Profits (Monica Kingsley) Stock Markets 5 hours ago (May 25, 2020 08:20AM ET)' - and the article says _>_'AFTER last week's attempt to reverse to the downside, stocks continued to reject lower prices in MONDAY's premarket session'_<_. 'LAST WEEK must mean the week before May 25th. But then the article implies that "MONDAY's premarket session" occurred after last week, i.e. that can only be today, but today the market is closed. -- So the whole article is wasted for me because if I can't be sure on the dates then it's too annoying to study it. It is important to properly set a date inside an article near the beginning because the date assigned to the article can change when the article is reposted and the reader can never be sure that it will not be reposted
The sentence about "Monday's premarket session" is within the weekly description part, and chronologically continues with the weekly bullish opening gap - the gap that was opened on May 18. I then go on to describe the week just over. Today's (May 25th) upswing isn't really mentioned there apart from the quoted fact that an upswing is likely to happen today - and it indeed did happen. Can I help anyhow else?
Monday (today) the futures are open ans so is the rest of the world (Asia & Europe) are all up ans thats Monday trading for you....0
Technical remark - there is no change in reposting days (i.e. the article is posted here the very same day I write it, and captures the outlook going into the regular US session's start), and the charts reveal the closing prices of the day mentioned exactly
What a bright picture for this wunderful ongoing upswing. However, given the lousy fundamentals, the buzzword crosses my mind: if something is too good to be true, it's just too good ...
There will surely come a time when the danger signs start flashing yellow or red. It's just not there right now
You believe you will get a flashimg light before the markets realizes the obvious? It's clear that i.e. Apple has lost 40m potential buyers in the US only and Tesla lost millions potential buyers in Europe. The only entity that is able to send such flashing lights is FED - but as long as its weapon last it will not send SMSs or similar - at least not to us ...
Do you expect to get a flashing light before the market is accepting the obvious? I only know one player who is able to switch such lights on or off. At least for 40m Americans an Apple iPhone or for millions of Europeans a Tesla has blocked by a flashing red ample and consequently an all time high is ridicolous ....
Very insightful and informative
Thank you Sarah! I don't know why my Friday's article doesn't appear in the feed of articles under my name - here it is so that you don't miss a thing ;) https://www.investing.com/analysis/yesterday-was-supposed-to-be-a-reversal-right-200525481
Risk Disclosure: Trading in financial instruments and/or cryptocurrencies involves high risks including the risk of losing some, or all, of your investment amount, and may not be suitable for all investors. Prices of cryptocurrencies are extremely volatile and may be affected by external factors such as financial, regulatory or political events. Trading on margin increases the financial risks.
Before deciding to trade in financial instrument or cryptocurrencies you should be fully informed of the risks and costs associated with trading the financial markets, carefully consider your investment objectives, level of experience, and risk appetite, and seek professional advice where needed.
Fusion Media would like to remind you that the data contained in this website is not necessarily real-time nor accurate. The data and prices on the website are not necessarily provided by any market or exchange, but may be provided by market makers, and so prices may not be accurate and may differ from the actual price at any given market, meaning prices are indicative and not appropriate for trading purposes. Fusion Media and any provider of the data contained in this website will not accept liability for any loss or damage as a result of your trading, or your reliance on the information contained within this website.
It is prohibited to use, store, reproduce, display, modify, transmit or distribute the data contained in this website without the explicit prior written permission of Fusion Media and/or the data provider. All intellectual property rights are reserved by the providers and/or the exchange providing the data contained in this website.
Fusion Media may be compensated by the advertisers that appear on the website, based on your interaction with the advertisements or advertisers.
© 2007-2024 - Fusion Media Limited. All Rights Reserved.