
After a bearish December, the first three weeks of January have been equally as strong, but in the bullish direction. These types of strong directional movements can make traders a bit nervous in taking a position in the markets. As we look to see what will happen with trading moving forward, we can calm some of our fears with the use of proper money management. This means you need to have an understanding of how much risk you are actually willing to take with each trade you make.
Knowing this will help you know exactly how many shares of a stock or how many contracts of an option you will be buying. Once you know this, you will have control over the effects that the market has on your money. While you cannot control the market, you can control how much you risk when you trade in the market. As you do this you will gain more confidence and be more comfortable in all your trades. Then you can feel good regardless of the direction price moves.
Let’s take a look at how the markets performed this last week.
DJ-30
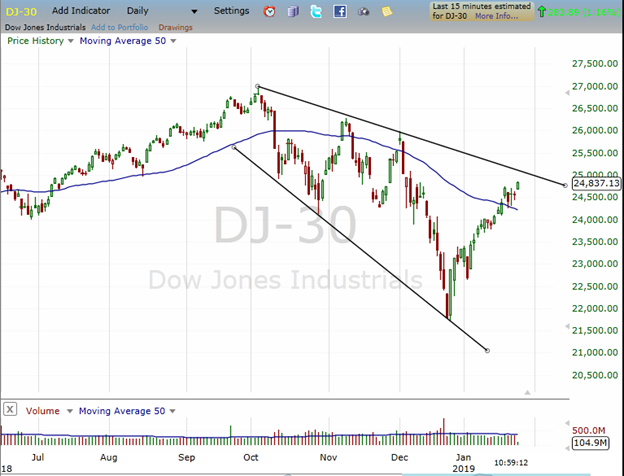
This week in Dow Jones 30 Futures, we have a daily chart which is showing some possible changes in what it wants to do moving forward. Notice a couple of things: First, the 50-period simple moving average continues to move down, but the price is trading above its line. This could signify that the bulls are building enough strength to continue moving prices higher. While this is a good first sign, the second thing we need to analyze is the fact that the upper trend line is continuing to move lower. These lower highs are a strong sign that the bears are ultimately still in control. Until price move above this line, we need to be looking for the price to move lower as it tests out this resistance.
SP-500
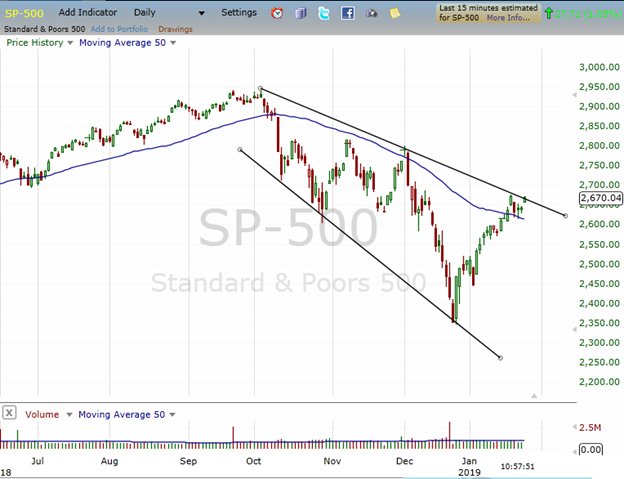
On the daily chart of the S&P 500 you can see a similar pattern that we see on the DJ-30. The one difference is that the price has actually moved right up to the overhead resistance line. This next week will show us if the bulls or the bears are going to take control again and move prices higher or lower. With the prevailing trend being down, we would look for opportunities to take trades that are supported by this bearish bias.
NASDAQ
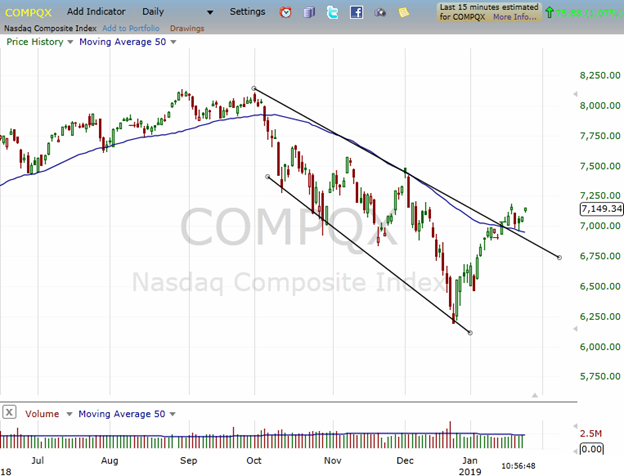
While we are also seeing a similar pattern on the NASDAQ as we saw on the other two, this chart has taken out the downtrending resistance line and is currently trading above it as well as the 50-period simple moving average. We will now see if the price can stay above this line even if it pulls back to retest it this upcoming week.
This upcoming week can be a pivotal week in the markets as we are sitting near some important support/resistance levels. We are also going to have the FOMC meeting on Wednesday as well as the Non-farm employment numbers being released next Friday. Both of these can play a significant role in pushing prices higher or lower. Again, make sure you are using good risk management as you place your trades this week.
After a strong bearish December, the first 3 weeks of January have been equally as strong but in the bullish direction. These types of strong directional movements can make traders a bit nervous in taking position in the markets. As we look to see what will happen with trading moving forward, we can calm some of our fears with the use of proper money management. This means you need to have an understanding of how much risk you are actually willing to take with each trade you make.
Knowing this will help you know exactly how many shares of a stock or how many contracts of an option you will be buying. Once you know this, you will have control over the effects that the market has on your money. While you cannot control the market, you can control how much you risk when you trade in the market. As you do this you will gain more confidence and be more comfortable in all your trades. Then you can feel good regardless of the direction price moves.