Another quiet and positive week, technically, in the US markets. For the third week in a row the market traded in a narrow range: 20 points, 20 points and 22 points this past week.
The last two weeks have been positive with new uptrends and highs. For the week the SPX/DOW gained 0.70%, and the NDX/NAZ gained 1.05%. Foreign markets had a better week. Asian markets rose 2.4%, European markets rose 1.3% and the DJ World index rose 1.1%.
Economic reports had a negative bias, with two down for every one up. On the uptick: consumer credit, import prices, consumer sentiment and the monetary base. On the downtick: wholesale/business inventories, retail sales, export prices, the WLEI, and both weekly jobless claims plus the twin deficits worsened. Overall, January has started off with a good positive bias. Next week, we’ll be watching the CPI/PPI, Industrial production and Building permits. Best to your week!
LONG TERM: bull market
Some weeks ago we anticipated the first couple of weeks in January would be the deciding factor for the ongoing bull/bear market inflection point. It certainly has been! The market, as measured by the SPX, has not advanced that much it price. Only up 2.5% for the year. While the market has continued to impulse higher, our long term technicals have greatly improved. In fact, when we review both the fundamental and technical data sets we track, they appear to be in the right position for a continuation of a bull market, not a bear market.
Consumer sentiment is beginning to improve after a three decade low. Economic indicators have been rising since October, after flashing a potential recession. And long term investor sentiment has begun to rise after being quite bearish just a month ago. All three fundamental indicators are still in a bearish mode.
While the economy is just beginning to improve and investors/consumers are still cautious, stock market technicals are getting quite positive. Our smart money indicator turned positive last week, and continues to improve. Market breath just made a new bull market high this past week. The number of stocks above their 200 dma has made a new high, after the October low, and is now over 50%. And the SPX monthly RSI has broken through neutral and continues to rise.
It looks like the market is in the early stages of a resumption of the bull market. Usually, investor sentiment gets extremely bullish and consumers turn quite positive before a bull market starts its topping process. We are currently nowhere near these kinds of readings. They are both still bearish!
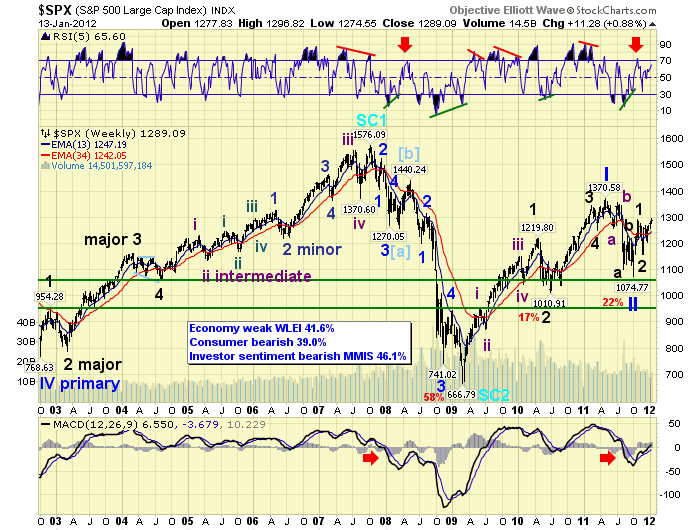
The SPX weekly chart displays our OEW count since late 2002. A Primary V wave bull market from Oct02-Oct07, ending the Supercycle, SC1, that began in Mar. 1932. Then a Supercycle bear market followed, taking the form of a zigzag, as the market lost 58% of its value. Next we have the early stages, Primary waves I and II, of a five primary wave Cycle [1] bull market, starting at the SC2 low in Mar09. Observe Primary wave III is in its early stages, having completed only Major waves 1 and 2 of its five major waves. The weekly MACD has turned positive again after dropping into bearish, (below neutral), territory. The weekly RSI touched overbought during the Major wave 1 uptrend, and is heading higher, after also hitting a bearish, quite oversold condition. These are all positives.
MEDIUM TERM: uptrend high SPX 1297
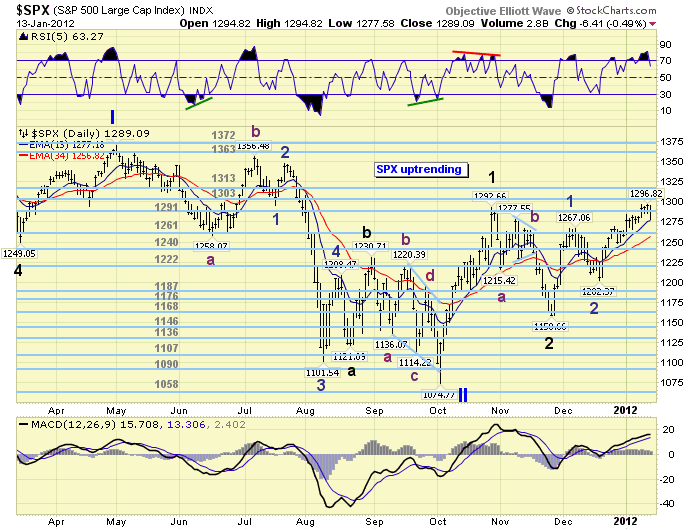
This uptrend started in late November and is now in its second month. Since May11 all trends have been one month or less, including the five waves down into the Oct11 low and Major waves 1 and 2. We have been counting the rally from SPX 1159 to 1267 as Minor wave 1. The pullback to SPX 1202 as Minor wave 2. And, the rally to SPX 1297, thus far, as Minor wave 3. If Minor wave 3 ended at the recent high, we’d expect a small pullback, not overlapping Minor 1, and then another rally to complete Minor wave 5 and the uptrend.
Since there is heavy resistance between SPX 1293 and 1327, we’re expecting this uptrend to be just Intermediate wave one of Major wave 3. Intermediate waves ii-iii-iv-v would then be needed to complete Major wave 3. If everything falls into place as expected, this entire bull market, from March 2009, should challenge the all time high at SPX 1576 before it concludes. But it needs to clear the May11 high at SPX 1371 by more than one percent first. That is the historical maximum level for a bear market rally during a Primary wave II.
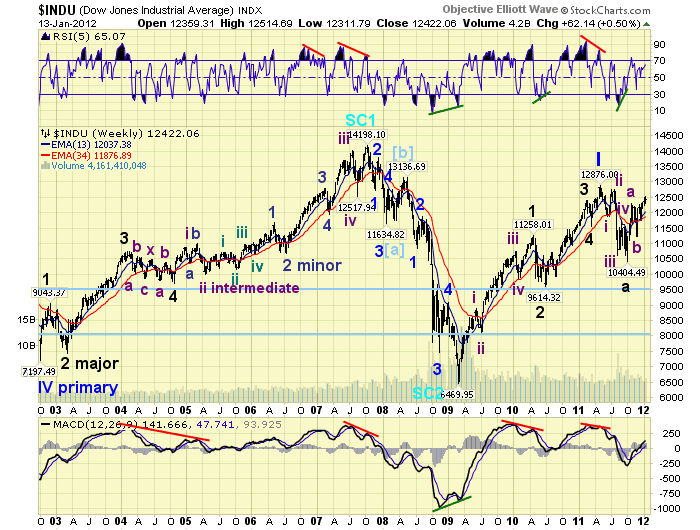
Our alternate count posted on the DOW charts below:
SHORT TERM: rising toward overbought
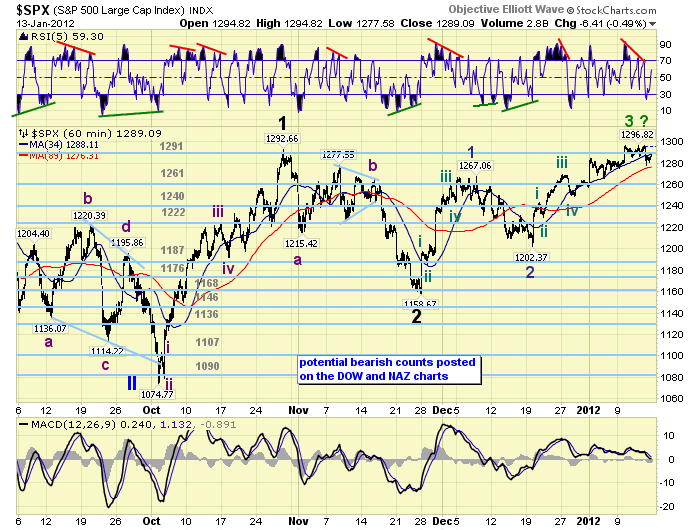
Support for the SPX is at 1278, the 1261 pivot range, and then 1250. Overhead resistance is at the 1291, 1303 and 1313 pivot ranges. Short term RSI momentum displayed a negative divergence at the SPX 1297 high. Dropped to oversold when the market dropped to SPX 1278. And was rising towards overbought on Friday’s late day rally.
We counted nine waves up for Minor wave 1, with pullbacks between 11 and 17 points. We also count nine waves up for Minor wave 3, with pullbacks between 11 and 20 points. Minor wave 1 traveled 108 points, and Minor wave 3 has traveled 95 points. Thus far, the wave structure and length are about equal. Should we get a pullback over 20 points this would suggest Minor wave 4 is underway, with support at SPX 1267 or a bit higher.
After that, Minor wave 5, to new uptrend highs, should unfold to complete the uptrend. Thus far, we have not received confirmation of a Minor wave 3 top. So it is possible this rally can still extend higher before Minor 3 ends. Short term OEW charts have remained positive since SPX 1230, with support now around 1280. Best to your trading!
- English (UK)
- English (India)
- English (Canada)
- English (Australia)
- English (South Africa)
- English (Philippines)
- English (Nigeria)
- Deutsch
- Español (España)
- Español (México)
- Français
- Italiano
- Nederlands
- Português (Portugal)
- Polski
- Português (Brasil)
- Русский
- Türkçe
- العربية
- Ελληνικά
- Svenska
- Suomi
- עברית
- 日本語
- 한국어
- 简体中文
- 繁體中文
- Bahasa Indonesia
- Bahasa Melayu
- ไทย
- Tiếng Việt
- हिंदी
The Bull Is Back
Published 01/16/2012, 01:52 AM
Updated 07/09/2023, 06:31 AM
The Bull Is Back
Latest comments
Loading next article…
Install Our App
Risk Disclosure: Trading in financial instruments and/or cryptocurrencies involves high risks including the risk of losing some, or all, of your investment amount, and may not be suitable for all investors. Prices of cryptocurrencies are extremely volatile and may be affected by external factors such as financial, regulatory or political events. Trading on margin increases the financial risks.
Before deciding to trade in financial instrument or cryptocurrencies you should be fully informed of the risks and costs associated with trading the financial markets, carefully consider your investment objectives, level of experience, and risk appetite, and seek professional advice where needed.
Fusion Media would like to remind you that the data contained in this website is not necessarily real-time nor accurate. The data and prices on the website are not necessarily provided by any market or exchange, but may be provided by market makers, and so prices may not be accurate and may differ from the actual price at any given market, meaning prices are indicative and not appropriate for trading purposes. Fusion Media and any provider of the data contained in this website will not accept liability for any loss or damage as a result of your trading, or your reliance on the information contained within this website.
It is prohibited to use, store, reproduce, display, modify, transmit or distribute the data contained in this website without the explicit prior written permission of Fusion Media and/or the data provider. All intellectual property rights are reserved by the providers and/or the exchange providing the data contained in this website.
Fusion Media may be compensated by the advertisers that appear on the website, based on your interaction with the advertisements or advertisers.
© 2007-2024 - Fusion Media Limited. All Rights Reserved.