Summary: Manufacturing is strong, household income is growing (driven by gains for the top quintile). Employment is the weak link in the recovery. The news media focuses on the monthly changes, mostly noise. Strong months confirm the narrative; excuses explain the weak months. In fact the economy’s trend remains locked near the 2% stall speed — supported by years of fiscal and monetary stimulus (now fading). Here we look at the December report. The key point: it gives no evidence that the widely expected second half growth acceleration has begun.
Contents (revised from the usual format)
- The big picture
- Did bad weather kill jobs?
- Household survey
- Establishment survey
- Unemployment
- Wages and hours worked
- What are the hot sectors for jobs?
- For more information about
(1) The big picture
This report dashes the hopes — again — of those hoping the US economy has returned to “normal” growth. The growth of non-farm payrolls was 75 thousand (SA), not statistically significant from zero (the minimum significant change is 92 thousand; details here).
This is no surprise to those of us who have said for four years that the US remains locked in a slow growth mode (aprox 1.7% in 2013). Now eyes turn to 2014, with the consensus forecast seeing faster growth 2.6% — but far slower than the 3.5% expected for 2013 in November 2011.
Consider the price paid for this slow growth. Not just the $774 billion in debt the USA accumulated during the past 12 months (4.6% of GDP), but also the as yet unknown results of 5 years of zero-interest rates and 3 rounds of quantitative easing (the third and largest still running, to be tapered in 2014).
As for 2014, there are too many variables to do more than guess.
(2) Did bad weather kill jobs?
Most questions and objections people raise to the Bureau of Labor Statistics have been considered in detail by their experts. Such as the effect of bad weather. From the report about December:
Unusually severe weather is more likely to have an impact on average weekly hours than on employment. Average weekly hours are estimated for paid time during the pay period, including pay for holidays, sick leave, or other time off.
… In order for severe weather conditions to reduce the estimate of payroll employment, employees have to be off work without pay for the {employee’s} entire pay period. … Employees who receive pay for any part of the pay period, even 1 hour, are counted in the payroll employment figures.
It is not possible to quantify the effect of extreme weather on estimates of over-the-month change in employment.
Below is an attempt to quantify it. Note that last month’s weather-related job losses were high, but not much higher than previous peaks during the past decade. 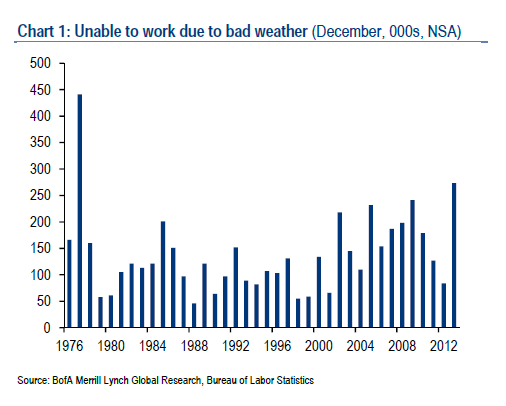
Here is the BLS report from February 2012 about bad weather’s impact on jobs.
(3) The Household survey (CPS)
The Bureau of Labor Statistics conducts two surveys: one of households, one of businesses. They are not directly comparable, each giving different perspectives on the US economy.
The Current Population survey looks at households. Compared to the survey of businesses it has large error bars; there are no revisions. It’s the basis for the headline unemployment rate, and gives useful data not in the more-accurate business (establishment) survey. Also, some research suggests that the household report shows inflection points before the establishment survey.
The monthly employment gains have been quite volatile, averaging about 60 thousand per month (SA) during the past five months and 65 thousand during the past three months — a pitifully slow growth rate of roughly 1% per year.
(4) The establishment survey (CES)
The second survey asks employers to report the number of civilian non-farm jobs. Although it usually shows a similar pattern of growth as the household survey, during the past year it has showed slow improvement — but at a faster rate than the household survey. It has smaller error bars, but gets large (sometimes massive) revisions.
Highlights for December:
- The gain of 75 thousand jobs (SA) is not statistically significant.
- The average gain over the last two months is 157 thousand (SA).
- The average gain over the past 12 months is 183 thousand/month, 1.6% per year (NSA). Faster than the CPS, but still slow.
- The manufacturing boom that so obsesses business journalists and Wall Street added a total of 77 thousand jobs over the past 12 months (+0.6%) — party on!
(5) Measures of Unemployment
(a) New claims for unemployment insurance are one of the most accurate and useful real-time measures of the job market. Compare the change in the 4-week moving averages of December (i.e., the 4 weeks ending January 4) and the same period in 2012 (seasonally adjusted; source here). December’s rise in claims erased much of 2013′s improvement.
- A year ago: 369 thousand
- Last month: 358 thousand (-3%)
(b) The unemployment rate — a complex metric that gets far too much attention
The analysts at BLS calculate six measures of unemployment, from narrow to broad definitions. None is more real than the others; none are easily comparable to the rough estimates of unemployment during the 1930s (the first reliable surveys were in the early 1940s). Most people consider U-3, or U-4, or U-5 as the most useful measure. The broadest (U-6) includes people with part-time jobs who prefer full-time work, and so includes the underemployed. These below numbers are not seasonally adjusted.
Any way you count it, unemployment has decreased during the past year. But the broader the measure, the slower the decline. U-1 down 17%; U-6 down only 10% (NSA). 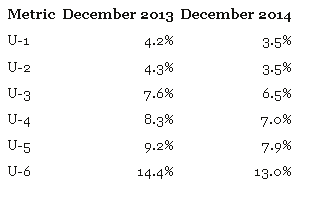
(6) Another important metric: wages and hours worked
Looking at nonfarm private workers in December 2013 vs. 2014 (seasonally adjusted), from the Establishment Report:
- Average hours worked per week: 34.5 vs. 34.4 (unchanged)
- Average hourly earnings: $23.75 vs. $24.17 (up 1.5%, unchanged after inflation)
- Average weekly earnings: $819.38 vs. $831.45 (up 1.5%, unchanged after inflation)
No signs of acceleration after a generation of stagnation, or of the Wage Inflation so dreaded by corporations and economists.
(7) What are the hot sectors for jobs?
From the BLS Highlights presentation about the December CES.
(a) Everybody wants to work in the Information Sector! Too bad its not generating jobs. 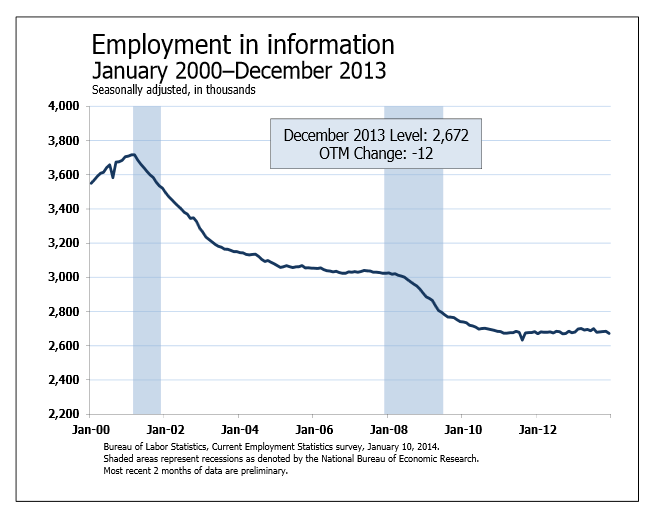
(b) Temping is a hot field: more jobs, but no benefits and no security.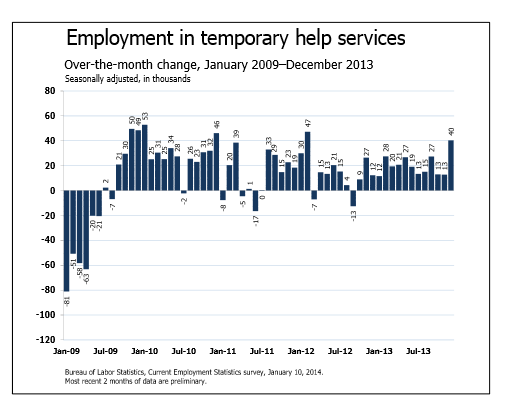
(c) Education and health services
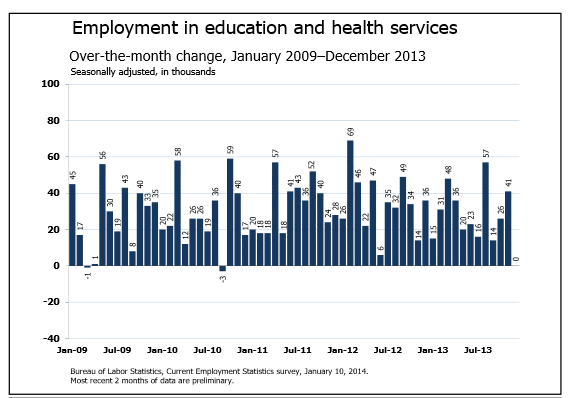
Employment grew by 321,000 in 2012, 208,000 in 2013, and zero in December. That was the weakest monthly change for this sector since September 2010. Both health care and education are overdue for radical restructuring, and its employment might stabilize — or shrink — over the next decade. For details see The education crisis spreads to the professions. Watch the universities crack, 2 January 2014. 