We have Apple (AAPL) in some accounts, including our own, and like many people are rather amazed at the dramatic price action in the stock, and the oppositional heat in the debate about whether Apple is a calamity or an opportunity. If you read the blogs, it sounds like the Republicans and Democrats in Congress. The devotion and conviction to either the bull or bear case for Apple is deep and intense.
As the current tug of war as played out on the price charts, the bears are winning. In the war of fundamental data and valuation, the bulls would be expected to be the winners.
The Danish physicist Niels Bohr (1885-1962) said “Prediction is very difficult, especially about the future.” – and that’s the big problem with Apple right now. The charts say look out below. The fundamentals say, Apple is no worse than, and maybe better than, Microsoft (MSFT) or Google (GOOG), but those aren’t tanking. The competitive landscape is getting tougher, but that only means Apple might not be able to grow super fast — just fast — and what’s so bad about that?
Next week, Apple will release its first quarter sales and earnings report (their first quarter is Oct – Dec, and is usually their best quarter).
There are lots of disembodied statements and question about the company, such as “Did Apple sell 50 million iPhones?” Without some context, you can’t know if that is a big enough number, and what it means in terms of growth. So, here is a table of data for the last six first quarters that will put their most recent quarter in perspective, and not just look at one dimension.
This table lists net sales by region, gross margin, unit sales by device type, net “cash” (cash, cash equivalents, short-term investments and long-term marketable securities less total long-term liabilities), and net “cash” as a percent of market-cap.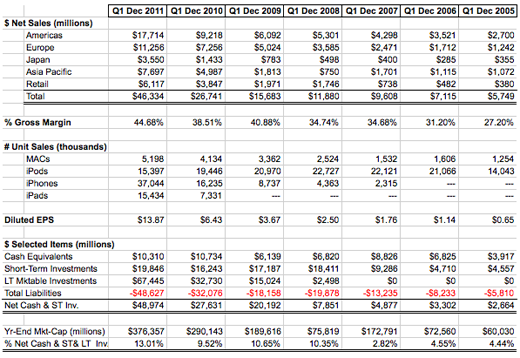
This is the scorecard that will probably determine if Apple stock sinks or swims.
Right now the $10.60 annualized dividend versus the $44.15 earnings per share is about a 24% payout — less than the current approximate 30% payout of the S&P 500. That leaves a 20% dividend increase just to get to “average”, before earnings increases, which also give room for dividend increases. The current yield is about 2.2%, which is about the same as the S&P 500.
However, while the yield is average and the payout is below average, the growth factors are well above average, and the leverage and free cash flow factors are superior. More on that in a moment. Let’s look at the painful-to-observe charts.
This long-term chart shows the Apple price fall into 2009, and the steady rise from then through 2011, and the steep rise in 2012 resolving to the current fall. The blue lines trace out a channel based on the time from post-2009 crash up to the time of the steep rise begun in 2012. Those two blue lines suggest a current price target in the broad vicinity of perhaps $475 to $550 based on the growth pattern prior to 2012.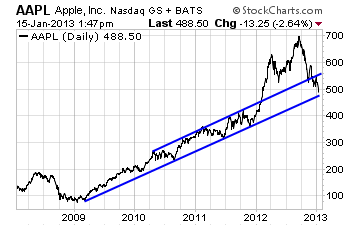
For additional perspective, the first iPod was introduced in November 2001; the first iPhone was introduced in late June 2007; and the first iPad was introduced in April 2010.
This chart is just the former chart up close in a shorter period.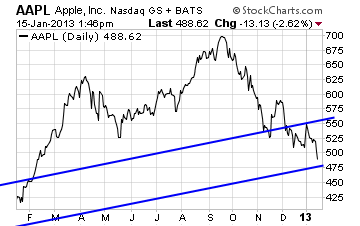
This next chart begins in June 2007, when the first iPone as introduced. It shows three things.
The blue trend line is a linear regression best fit trend line from the iPhone introduction date, through Tuesday, and extended out to the end of 2013. It extends to about $640.
The green trend line is also a linear regression fit, but it starts at the stock market bottom for Apple in 2009 and goes up to the period where the price chart got very steep, and then extends out to the end of 2013 (it does not consider the pre-2009 period or the “steep” period beginning in 2012). It extends out to about $650 by the end of 2013. Those are not certainties, but they do give a potential heading for the price, if Apple is able to keep up its multi-year head of steam.
The little red curve line is a 1-month price probability range based on the 1-year historical price volatility, using a 90% probability. In other words, if the volatility over the next month is the same as the volatility over the past year, there is a statistical probability of 90% that the price by mid-February will be between about $455 and $550.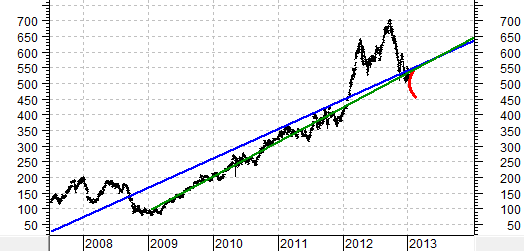
Some of the key negative arguments about Apple include:
- They need a new WOW product, not just incremental improvements on old ones
- Steve Jobs was the real reason for Apple’s success and he is gone
- The iPad Mini and expected lower cost iPhones for emerging markets will harm gross margins
- Samsung is eating their lunch
- Apple’s patent litigation has not created a good wall to keep away the competition
- Android is more innovative
- The phone carriers want more phone competition and don’t want to be Apple’s captive
- China Mobile is selling for other phone companies, but not Apple, because they won’t subsidize sales like Apple wants
- Microsoft directly or indirectly has an evolving presence in the phone and tablet space that takes away from Apple
- Apple is cannibalizing its iPod and computer lines with the phones and tablets
- Markets for those who can afford high end products may be saturated
- Apple is relying heavily on phone and tablet upgrades, and the new features don’t compel action
- Nobody can touch them on elegance and ease of use
- Nobody else has the retail store footprint or selling style
- Nobody else has the ecosystem of devices, software, apps and content and total product technical support
- China will become their #1 market and keep the money rolling in
- Apple and China Mobile (600+ million subscribers) will eventually reach a distribution agreement
- Apple is not done innovating in devices, software or content
- Apple’s fundamentals and valuation are better than all of their competition
- Apple’s net cash wealth will allow them to be both a growth company and a value and dividend company at the same time
- A significant portion of Apple’s stock price is net cash, effectively making their valuation multiples lower than they already seem
- Declining market share does not mean declining sales (it’s a really big pie)
- Did you try to get into an Apple store over the holidays? Did you try to buy a iPad mini over the holidays? They were gangbusters.
While Research in Motion (Blackberry) (RIMM) and Nokia (NOK) are players, their financials and price charts are a mess, so we’ll leave them out. Samsung (SSNLF) is the gorilla, but unfortunately, we can’t chart their data. These charts focus on Apple, Microsoft and Google — all significant players in one way or the other.
Google is the supplier of the Android phone operating system, and Microsoft is bent on creating an alternative ecosystem. They now have directly or indirectly; computers, laptops, tablets and phones, all wrapped in a single operating system, with an evolving app store, a cloud storage system, a cloud based Office service, and perhaps most of all, ability to run all Windows programs on there to be release Surface Pro tablet, and they are better situated to penetrate the corporate environment with their tablets than the iPad.
PRICE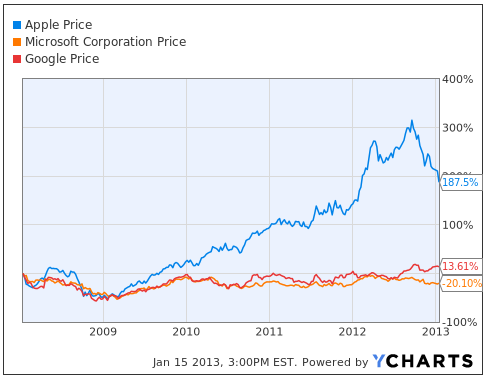
Apple’s price rise (associated with a corresponding sales and earnings rise) massively outpaced Microsoft and Google, even after the recent drop.
REVENUE GROWTH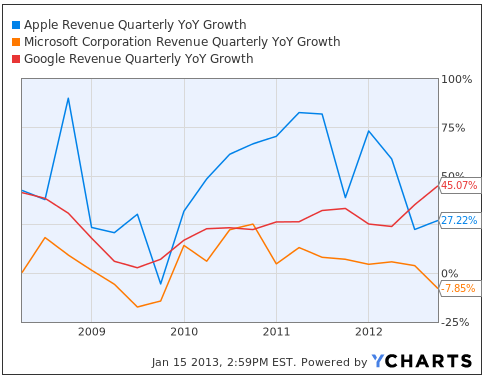
Apple’s year-over-year quarterly revenue growth, is much better than that of Microsoft, better than Google until just recently, and (not shown) better than that of the S&P 500. — but prices for Microsoft and Google are not crashing.
RETURN ON EQUITY
Apple’s return on equity is much higher than that of Microsoft and Google.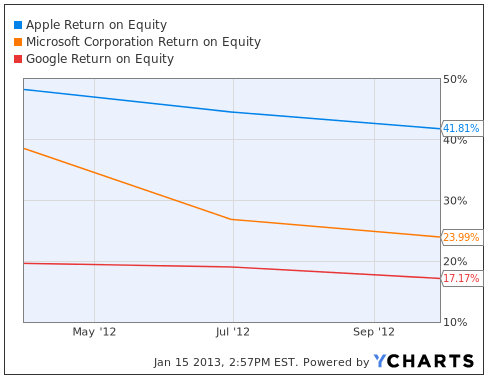
P/E RATIO
The conventional price to earnings ratio for Apple is lower than that of either Microsoft or Google, yet, Apple is growing faster and has more net cash, and has a higher return on equity.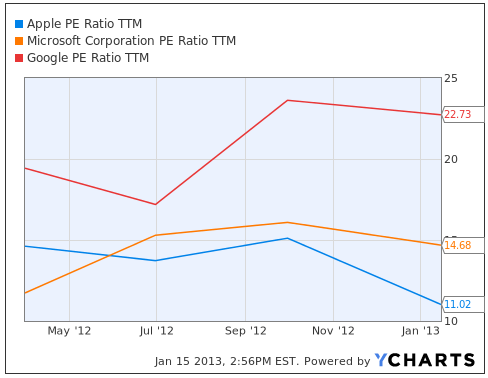
EV/EBITDA (Enterprise Value to Earnings Before Interest, Taxes, Depreciation and Amortization)
EV/EBITDA is a way to look at a company from the perspective of a buyer of the whole thing. It includes debt to be assumed and strips out excess cash, among other things — the lower the ratio the better. Apple is much less expensive than Google and about the same as Microsoft.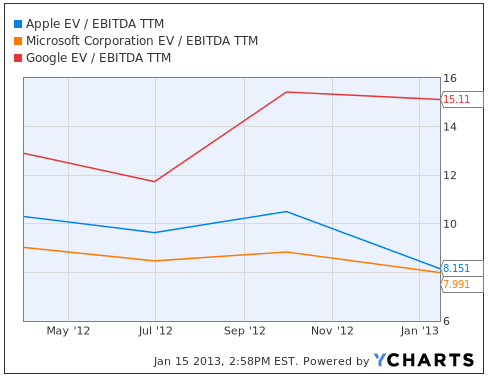
Let’s see what the analyst community has to say. We understand that they are all over the lot with lovers and haters, momentum and value investors, but let’s look at the range and perhaps take some comfort from the average.
1-YEAR PRICE TARGETS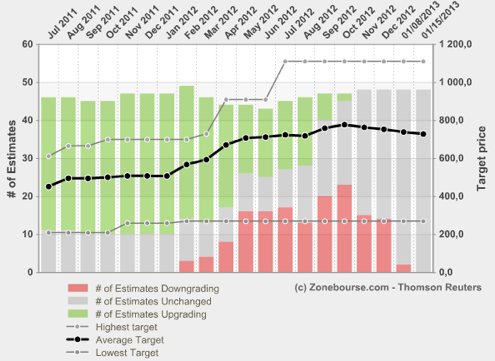
This chart shows the evolution of the high, low and average 1-year price target from 56 reporting “street” analysts. At the extremes (usually wrong), we see a low of $270 and a high of $1,110, but an average of $729.
At $270, the P/E on current trailing earnings would be about 5.5x. That is a crazy number, unless earnings collapsed going forward.
At $1,110, the P/E on trailing earnings would be over 25x, which sounds rich. A multiple of 25x back in the dot.com era would be paltry, but today there is a bit more rationality to pricing technology companies.
At $729, the P/E on current trailing earnings would be about 16x. That seems to be a reasonable number in relation to the current multiple on the S&P 500, which is about 13x; or the current 14.7x multiple on Microsoft, or the 22.7x multiple on Google.
Here is how the price (black) has compared to the analyst predictions (blue) over the same 18 months. While analyst ratings are wilting a bit, they have definitely not followed the price.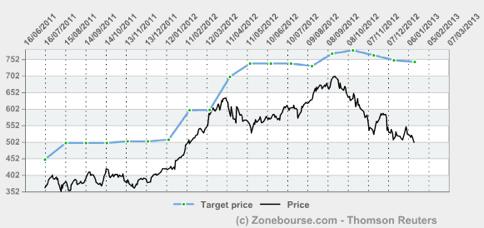
Here is a view of the high and low and average price targets in terms of how much the price would need to change to reach those levels. The range is up 45% to the average target, down 46% to the low target, and up 121% to the high target.
Of the 56 analysts, there are 2 SELLs, 1 UNDERPERFORM, 6 HOLDs, 21 OUTPERFORMS, and 26 BUYs.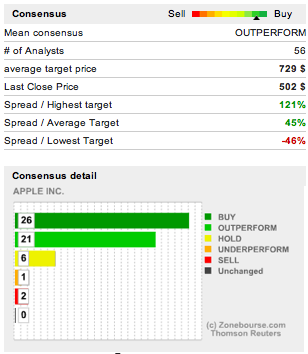
ThompsonReuters has a service called StarMine, where they identify those analysts who have been most accurate in each sector. From that reduced list of analysts, they compile a rating for each stock. Here is the StarMine rating on Apple. Their view is skittishly neutral on average, with Standard and Poor’s as the big bull among them.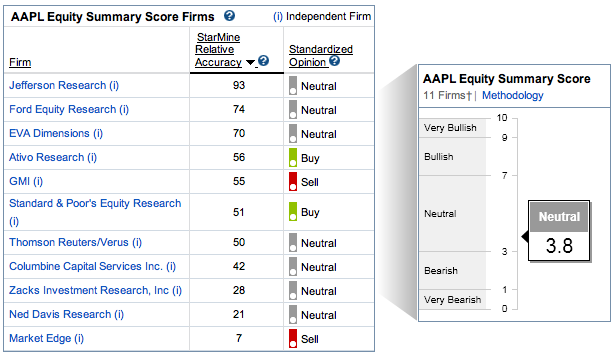
Bernstein Research put out an interesting observation. They studied many hundreds of mutual funds and found that fewer growth mutual funds now own Apple, and they hold it at lower average portfolio weight. However, they found that more value mutual funds hold Apple. They postulate a rotation of one type of investor out of Apple, and the rotation of another type in. That would not be a one-for-one exchange, but does tend to suggest support developing for Apple coming from a different quarter.
Here are “street” analyst consensus estimates of operating income, book value and cash flow out for the next three years (2013-2015). They show cumulative 43% growth in operating income (about 12.5% annualized), a 102% growth in book value (about 26.5% annualized), and a 36.8% growth in cash flow (about 11% annualized). These are good numbers in general, but not as good as recent numbers for Apple. It is axiomatic that as a company grows, its rate of growth must moderate, but this is part of what’s bothering the market.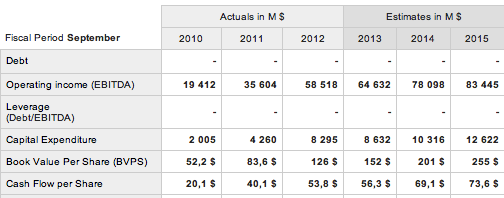
Those numbers are good, but not spectacular. They put the PEG ratio (P/E divided by expected growth rate) at more like 1 than the ThompsonReuters 0.5 PEG. There is plenty of room for disagreement on the PEG — after all it is about the future, and different sources give very different numbers. However, 1 is still an attractive PEG ratio. There are plenty of stocks doing nicely in terms of price growth with PEGs of 2 and 3, even 4. The S&P 500 has a PEG in the vicinity of 1.3. Microsoft has a PEG of 1.10, according to ThompsonReuters, and Google has a 1.35 PEG
Look, you can’t fight the tape, but what you do depends on your investment style, time frame and personal risk taking limits and other needs.
If you are a trader, you should have been long gone by now and not back in until the direction changes or some clear sign of a bottom is in.
If you are a long-term investor, there is rationale for suffering through all this, or building a position from here.
We have some. We feel burned, but are not traders and intend to wait until the earnings announcement next week.
Before January , we thought the selling was mostly capturing gains ahead of the expected increase in capital gains taxes. That was wrong. If next week’s announcements fail to assure, then we have to reassess, but we expect a favorable outcome.
Time will tell, and it will tell soon.
