SPX Monitoring purposes: Covered 12/30/16 at 2238.83= gain .46%; Short on 12/29/16 at 2249.26.
Monitoring purposes Gold: Long GDX (NYSE:GDX) on 12/28/16 at 20.25.
Long Term Trend monitor purposes: Short SPX on 1/13/16 at 1890.28

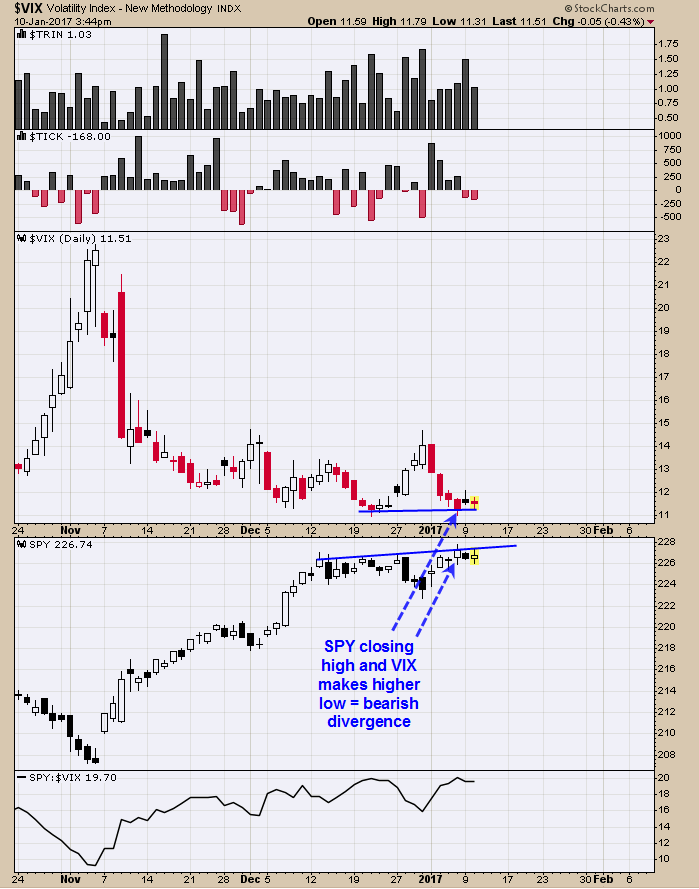
The SPY (NYSE:SPY) on January 6 made a higher high and the VIX made a higher low and a bearish divergence. In general, the VIX trades opposite of the SPY and when the VIX doesn’t confirm the SPY and high or low in the SPY could be in development. It's common for the market to produce tops and bottoms around important events and the next important event is the January 20th inauguration for President-Elect Trump. Also, round numbers can produce reactions and the Dow Jones is flittering with the 20,000 level. There are bearish signs here but signal is incomplete.

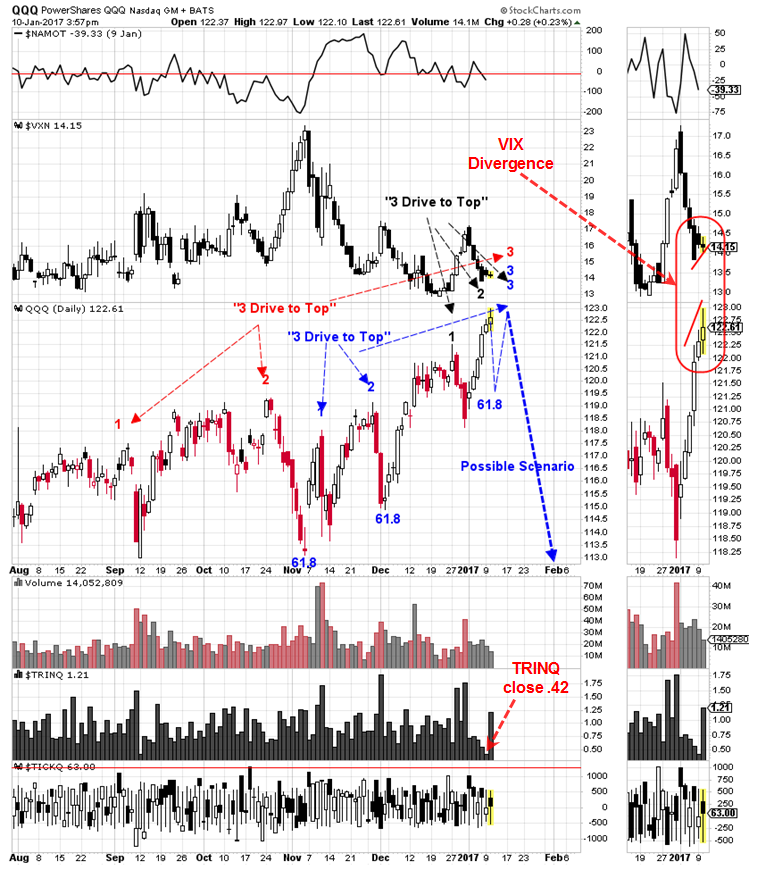
The last two days, the VXN has made higher lows and the QQQ (NASDAQ:QQQ) has made higher highs which is a negative divergence and a short term bearish sign. Also the TRINQ closed yesterday at .42 and lowest close since 8/27/15 which was a day before a top on the QQQ. A possible scenario may be developing here is a multiple “Three Drives to Top” forming on the QQQ.
It looks as though a short term pull back could start at any time, but may stop at the 61.8% retracement level before another rally up to finish this potential multiple “Three Drives to Top” pattern that may finish next week. Next week is option expiration week, which normally has a bullish bias. It's common for markets to bottom or top on important events and the next important event is next Friday's Trump Inauguration. Covered 12/30/16 at 2238.83 = gain .46%; Short on 12/29/16 at 2249.26.

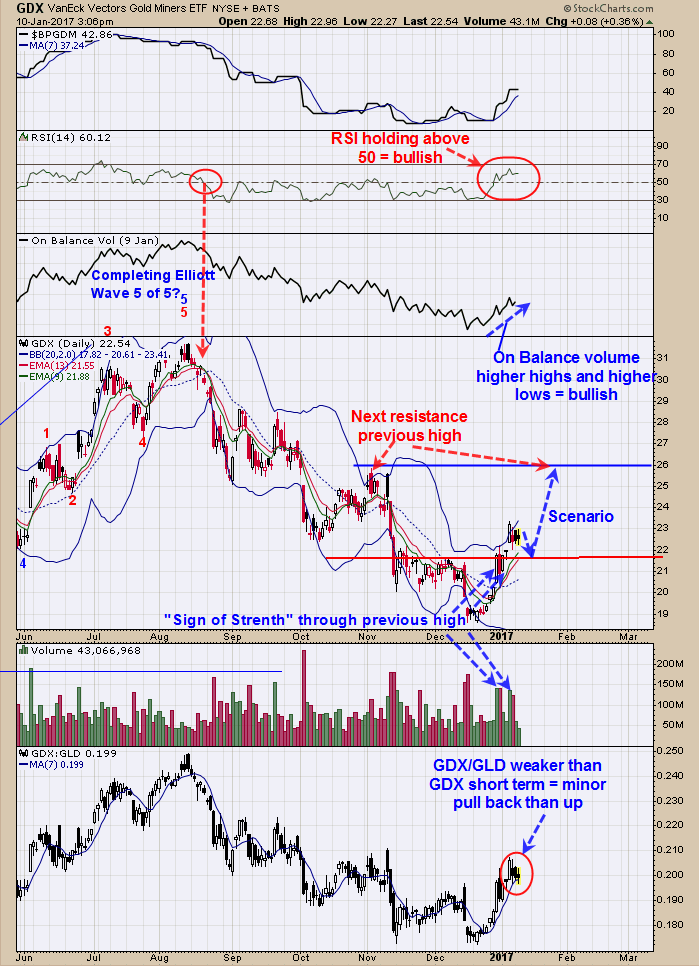
The above GDX is a short term view that may develop in the coming weeks. In late December and early January, GDX produced a “Sign of Strength” through the highs of late November and early December near 22.00 and now the 22.00 level should act as support. Also, the RSI jumped above the 50, since staying below 50 going back to August and another bullish sign.
Also on balance volume has been making higher lows and higher highs since mid December confirming the uptrend in GDX. For very short term GDX/GLD (NYSE:GLD) ratio is weaker than GDX and suggests a minor pull back, but should find support near 22.00 range. Next upside target is near last November's highs near 26.00 range. In general, GDX should continue to move higher. Long GDX on 12/28/16 at 20.25.
