
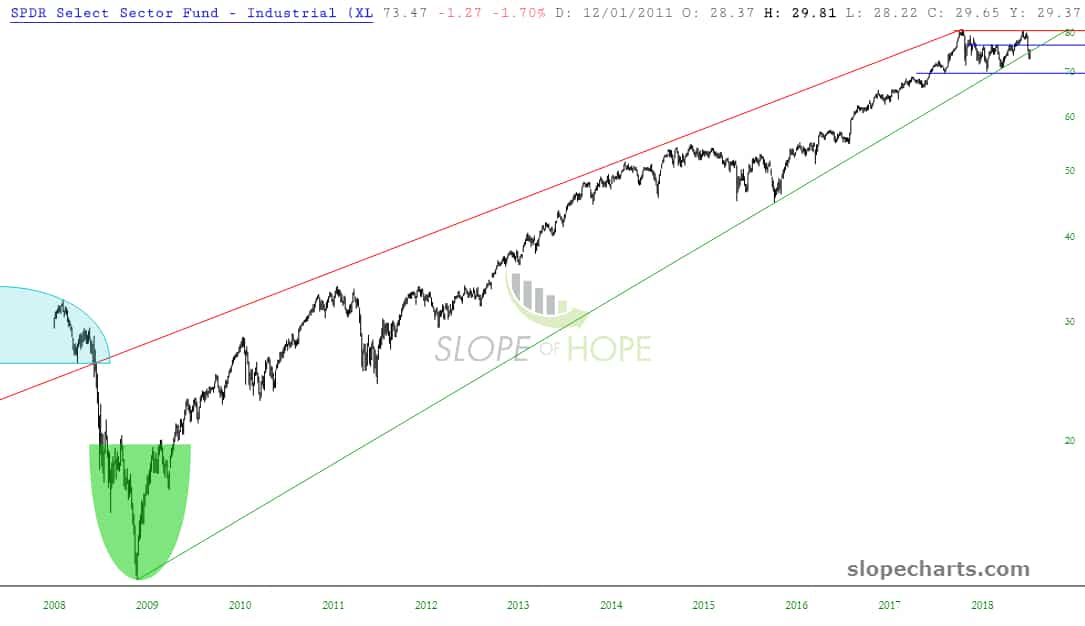
These are all ETFs, and they all have the same message: it is time for the bears to rise again! We begin with the Industrial symbol XLI, which has broken its long term trend from 2009:
I’m so enthusiastic about XME (mining), I shorted it and bought puts too. I’m showing only the moving averages here.

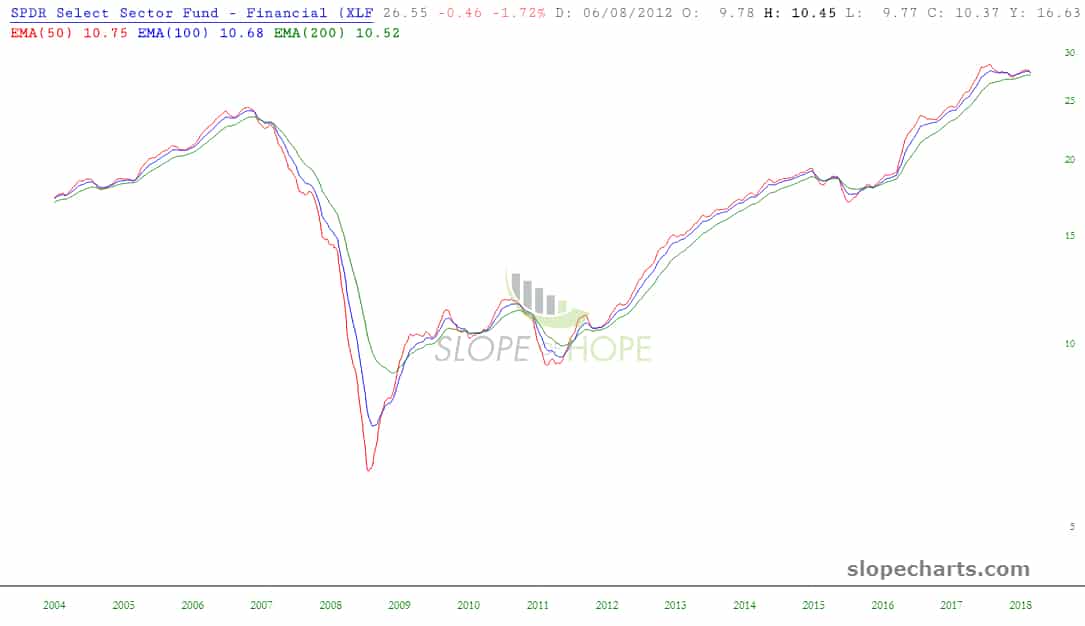
I’ve done the same with financials (XLF) which I consider more important to watch than almost anything else.
Likewise I consider bonds (TLT) critical, and my Gold and Diamond members know how this relates to the Most Important Chart Ever (MICE) that I’m so hung up on. The topping pattern is nearing completion.

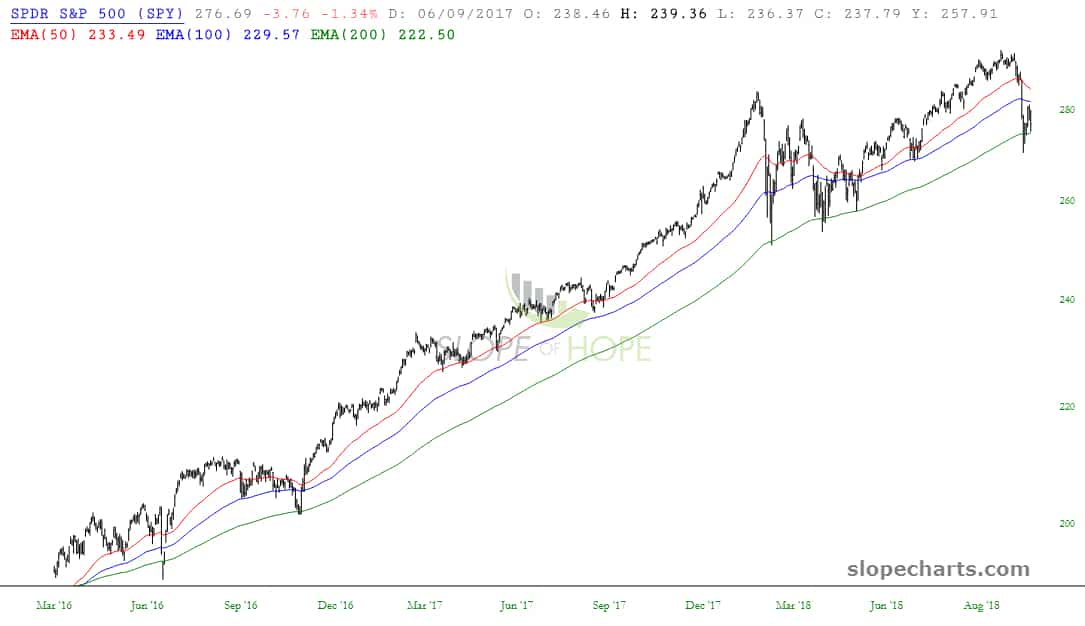
The S&P 500 has been in an uninterrupted uptrend since the days of the railroad barons. You can see how smooth the moving averages are, even with the recent tumble. I’ll be watching SPY (NYSE:SPY) closely for a crossover.
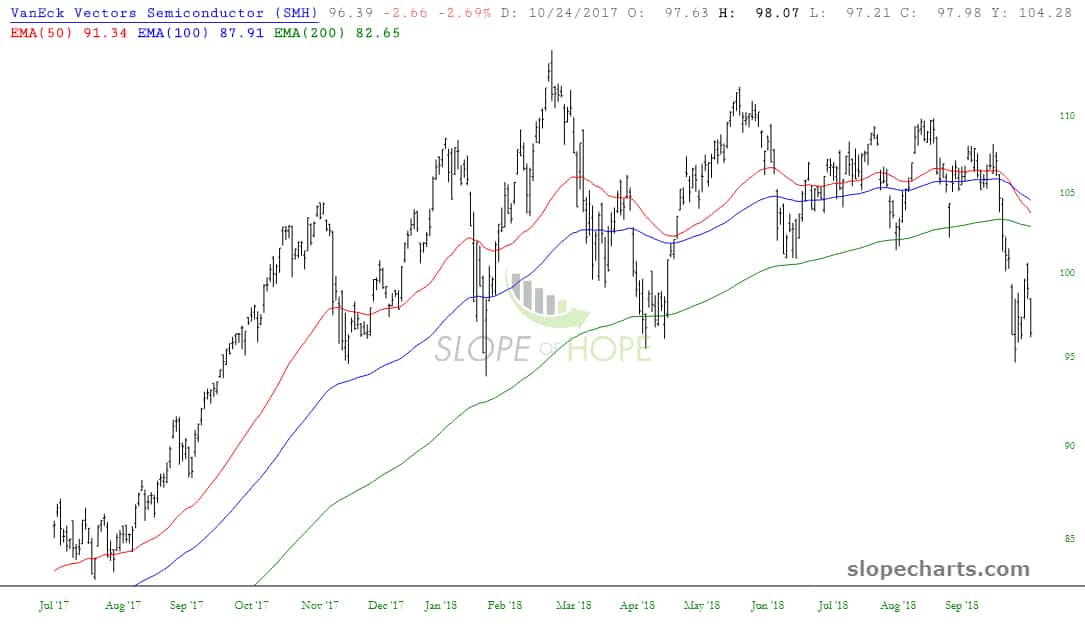
There’s probably no more exciting sector out there on the short side besides semiconductors, and I’ve got puts and a short position on SMH, which is its representative fund. There’s a fantastic diamond top pattern, and as you can see, the 50 EMA has broken the 100 EMA with its sights set on the 200 DMA.
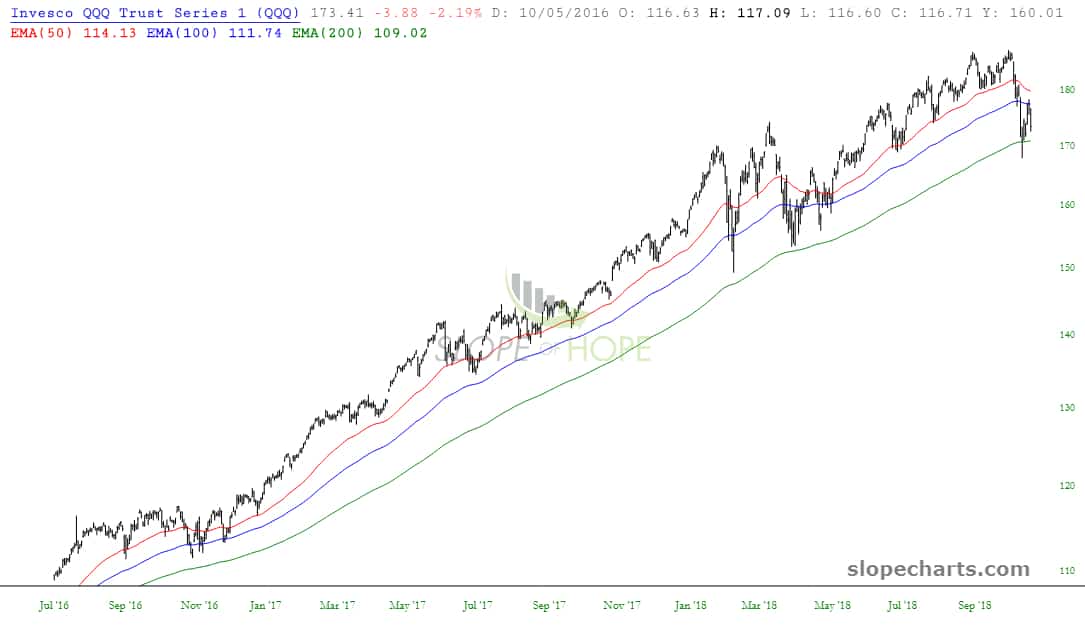
The same can be said for QQQ, the NASDAQ 100, whose moving averages dare not cross one another. It’ll take a lot more weakness in the near term to get those crossovers going.
Regional Banks, KBE, are clearly in a downtrend. We’ve got crossovers galore and a gorgeous topping pattern.

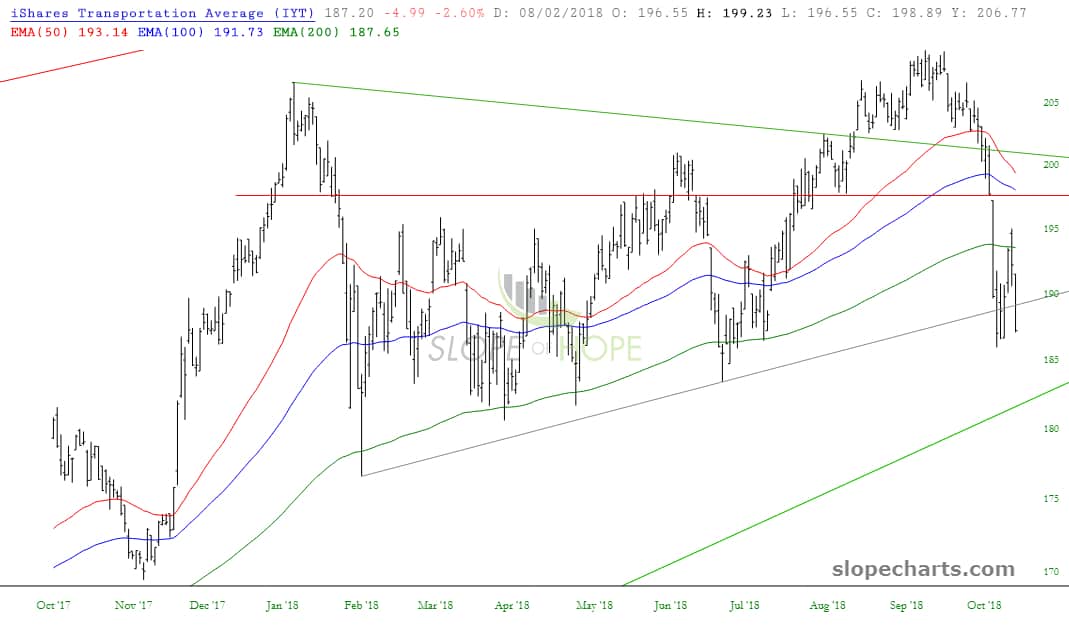
Although the Transports (IYT) haven’t done their downward crossovers yet, they’re a heck of a lot closer than SPY is to doing the deed.
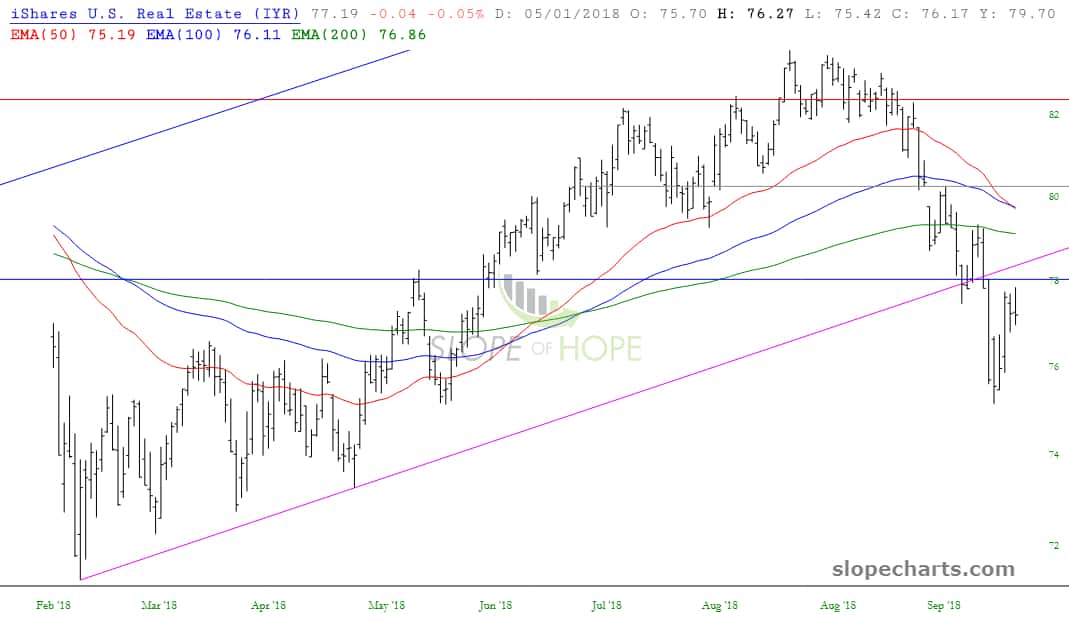
Real estate, by way of IYR, is only just now about to have the 50 day EMA cross below the 100 day.
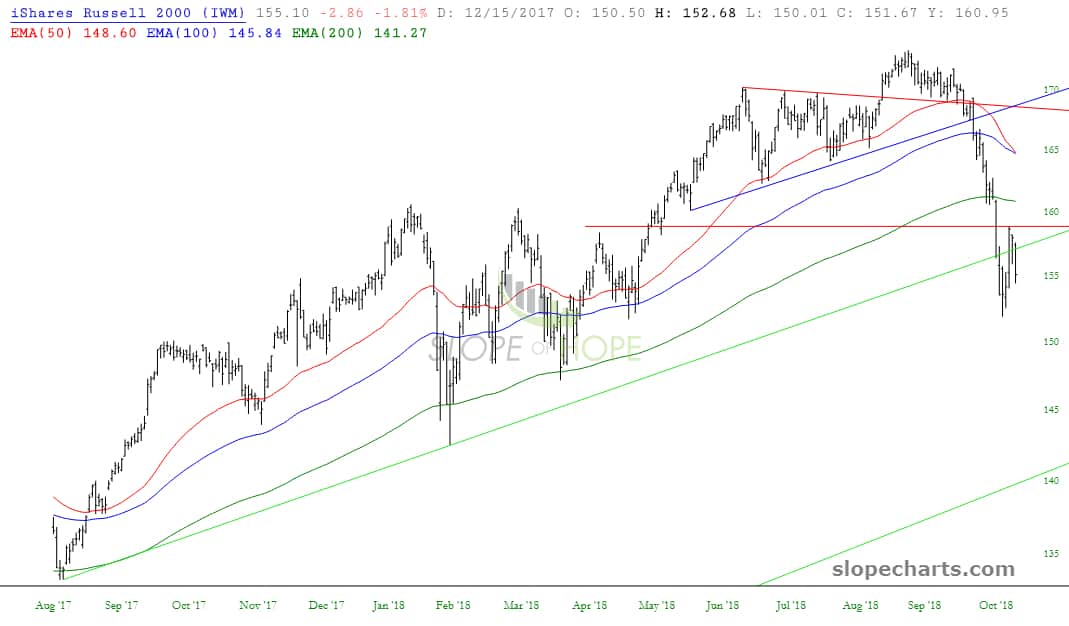
The same can be said for the Russell 2000 symbol IWM which has also just recently pierced an intermediate-term trendline.
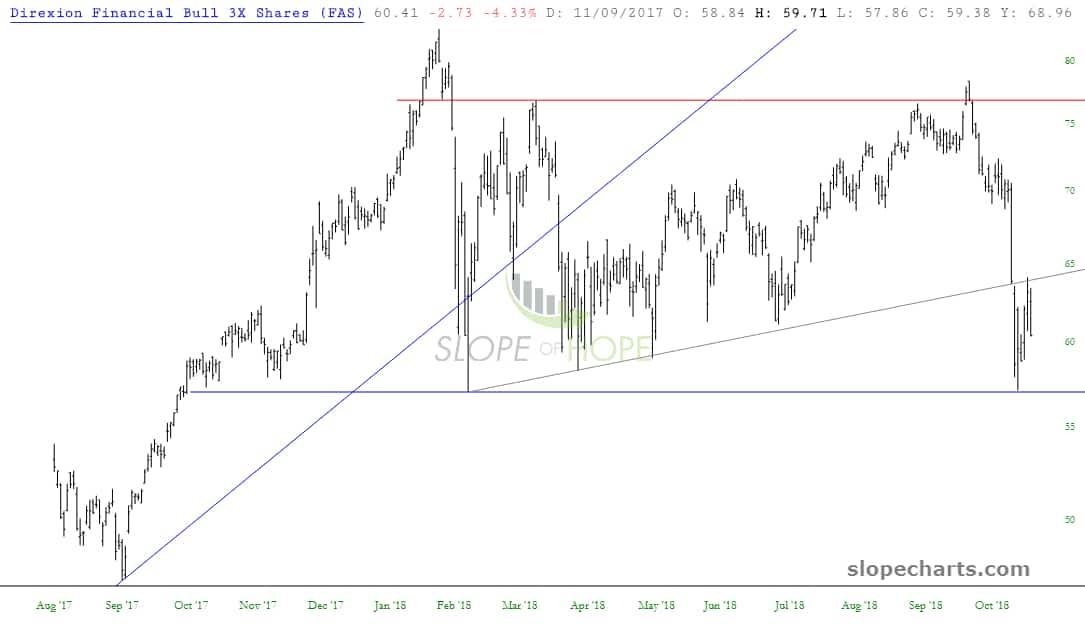
I was delighted on Thursday that financials resumed their weakness. The triple-leveraged symbol FAS has a clean reversal pattern at its broken trendline.
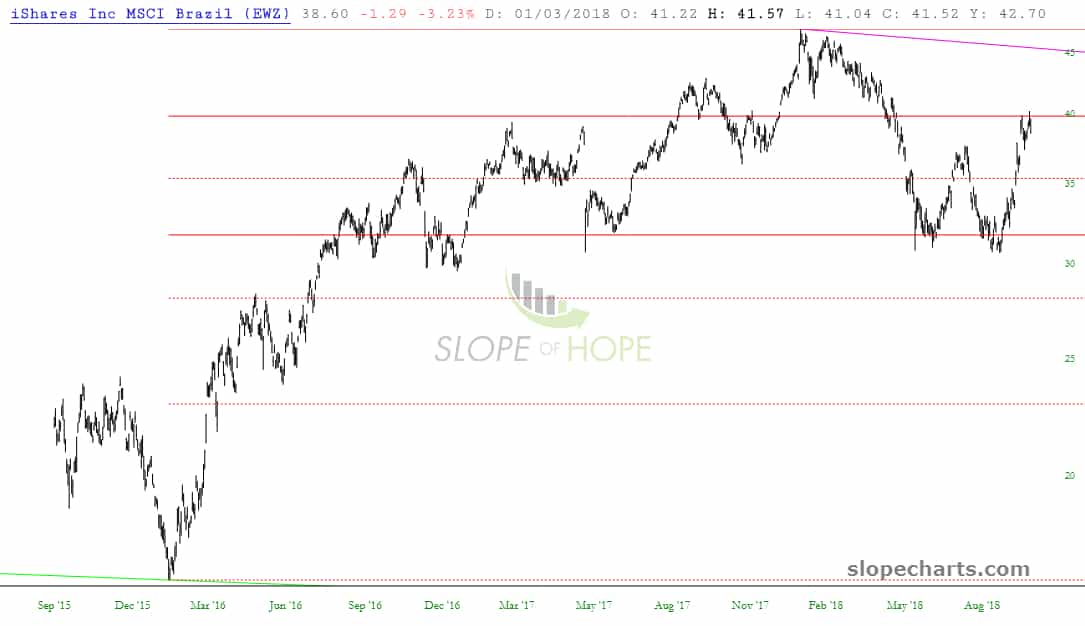
Fibonacci retracements on Brazil (EWZ) have been helpful. I’ve got January 2019 puts on this.
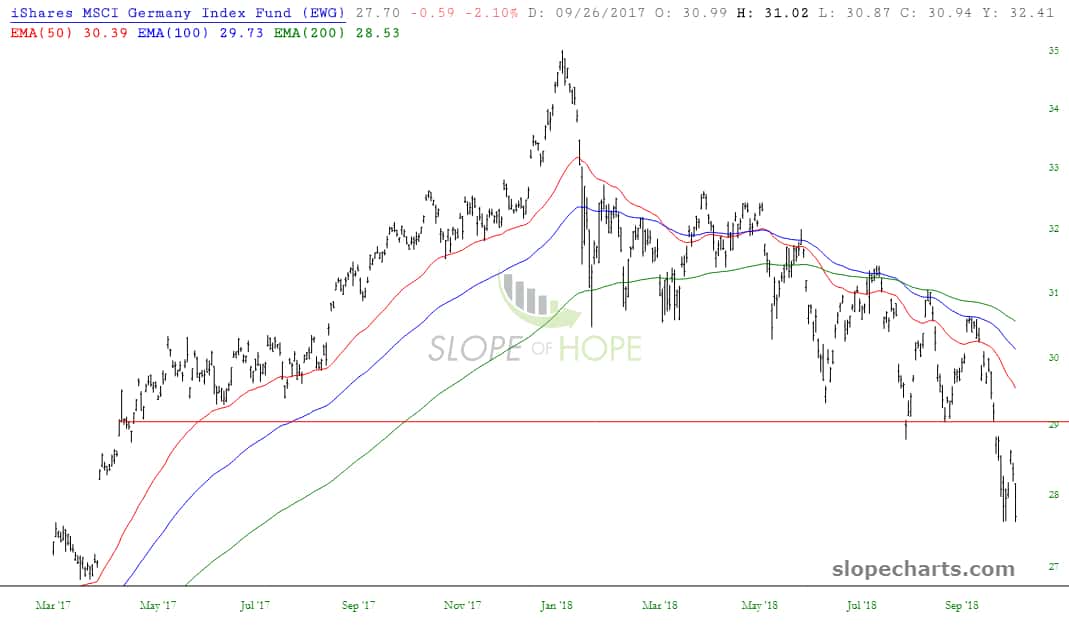
I scanned the ETF database for high-volume instruments and realized I hadn’t been following Germany, symbol EWG, which is sporting a respectable topping pattern.
Canada, which I also just added to my watchlist via symbol EWC, has recently formed a nice little reversal pattern.

Emerging markets are still a hot mess, and 2018 has been nothing but lower lows and lower highs since January 26th for EEM.

A more exaggerated view of real estate can be seen with Direxion :DRN), which quite plainly has been breaking down. The next ‘goal’ is to snap below that blue trendline.

In spite of all the tumult in the market, the Dow Industrials DIA is quietly resting on its 100 day EMA, which it has done many times in the past. There is no true breakdown yet.
