Theory and practice in money management have a rocky relationship. What looks good on paper often suffers a difficult and even a fatal transition to the real world for several reasons, including trading costs, human error, and the ever-present burden of an uncertain future. But some models do better than others as portfolio strategies. At or near the top of this short list is what’s known as the global minimum variance portfolio (GMVP), which by design is a mix of assets that minimizes volatility. The success of this strategy violates modern portfolio theory, which tells us to build “optimal” portfolios, i.e., holding a combination of assets that maximizes expected return at a given level of risk. But many empirical studies show that portfolios that focus on minimizing volatility generate superior out-of-sample results. As such, it’s useful to consider how your current portfolio compares if you were to reweight it to reflect a GMVP strategy.
It’s reasonable to wonder why GMVP tends to outperform a classic optimized portfolio. One explanation is that it’s a bit easier to forecast and manage risk compared with projecting returns. Whatever the reason, GMVP presents a useful framework if only to study how an existing asset allocation strategy compares. GMVP, you might say, offers an alternative benchmark for a given set of assets. With that in mind, let’s run a quick test on how the major asset classes stack up in the framework of a GMVP. Using R software, crunching the numbers is relatively straightforward.
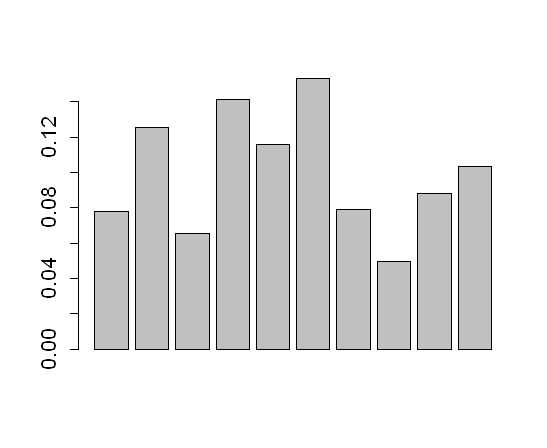
One way to begin is reviewing how random data looks in a synthetic GMVP test. Using Enrico Schumann’s R code, we can easily create test portfolios using a wide variety of assumptions about expected volatility and return. For example, here’s how the allocations for a 10-asset portfolio look with randomly generated data based on a zero mean and a 5% standard deviation:
Note that the allocations are in a relatively tight range, from around 5% to 15%. That’s not surprising since we’re using random numbers.
A more useful test is plugging in actual performance data. As an example, let’s use the historical monthly returns for 11 asset classes via the indexes used on these pages in the monthly updates of the major asset classes (see here, for instance). Note that I’m leaving out a few markets because in this test we’re using only those indexes with at least 14 years of historical data (through January 2014). Ideally we should use longer samples, but in this case will use a relatively short set of track records.
A few other points are worth mentioning before we look at the results. First, short sales and leverage aren’t allowed in our simple example. Computing GMVP allocations with real-world data in an unconstrained framework tends to lead to highly concentrated portfolios. Extreme outcomes might be reasonable if we had a high level of confidence in the critical assumption in such matters: estimating the covariance matrix of returns. But anything approaching certainty is the stuff of dreams in portfolio management and so it’s best to assume that even the best forecasts will stumble in some degree. As such, I’m also imposing a somewhat arbitrary constraint of no more than a 25% allocation in any one asset.
In addition, I’m estimating the covariance matrix using a shrinkage estimator—the Ledoit-Wolf estimator, to be precise. As the authors of this estimator noted in a widely read paper, “nobody should be using the sample covariance matrix for the purpose of optimization. It contains estimation error of the kind most likely to perturb a mean-variance optimizer.” In plain English, the market’s capacity for extreme outcomes at times can create havoc for developing reasonable assumptions about risk and return.
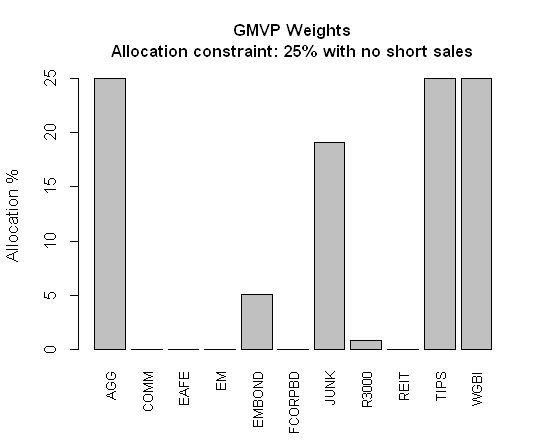
There are a number of applications to manage the so-called fat tails issue. Ultimately, the results are only as good as the estimates you plug into the covariance matrix. If this was an actual portfolio, I’d spend a lot of time developing ex ante data. But for simplicity here, let’s just take the raw historical numbers and process them through a shrinkage estimator. Without further ado, here’s the resulting GMVP allocation based on the constraints noted above:

What’s interesting is that the optimization process favored five asset classes: US bonds (AGG), Emerging markets bonds (EMBOND), US high yield bonds (JUNK), inflation-indexed Treasuries (TIPS), and foreign government bonds in developed markets (WGBI). Notably, there’s only a token allocation to US stocks (R3000).
We can, of course, engineer different outcomes if we adjust the constraints. And that’s the point. Building GMVP, or any other “optimized” portfolio, is largely a process of choosing preferences and favoring what you see as reasonable assumptions. Indeed, other than buying all the major asset classes and weighting them based on market values, any portfolio you hold is going to be a customized strategy. GMVP is no different. It’s certainly provides a robust methodology for building portfolios, but for good or ill it also requires a healthy dose of one thing that’s missing in Mr. Market’s passive asset allocation: subjective decisions.

