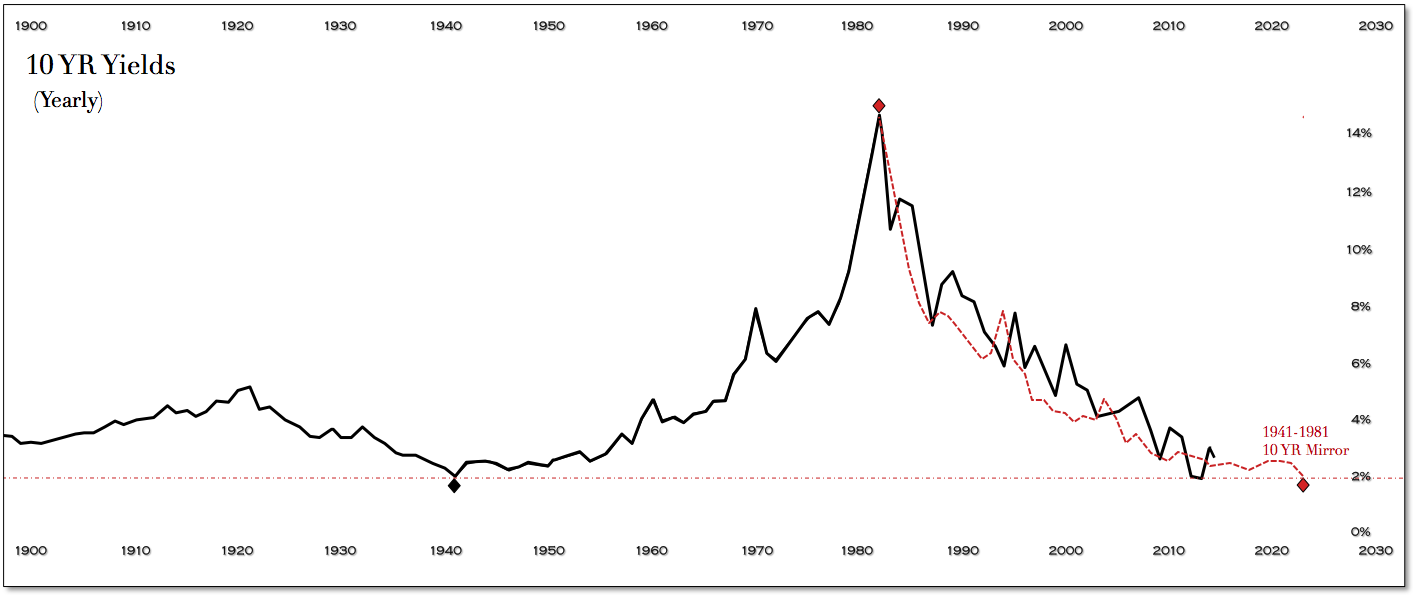
We've made the case before (see here) that for all the pomp and circumstance, Fed policy over the last three decades has done very little to deviate yields from what became a genuinely symmetrical and balanced return from the profound 1981 highs. Where they have had effect— we would argue—is around the fringe, by introducing volatility to the slope of the decline, with numerous interventions and surprises as they navigated various market conditions.
The chart referenced below of the with the 1941 to 1981 mirrored trajectory captures that story, especially when contrasted with the relative smoothness of the previous long-term cycle in the first half of the 20th century, when the Fed was still in its infancy and developing the first edition textbook of accommodation and reduction, which they have continued to build upon with each passing cycle.
On both sides of the spectrum—whether through bailouts, interventions or rate tightenings—the Fed has looked to shake the tree from time to time when the markets are deemed too complacent, accommodative or risk adverse. Coincidentally, or not, these occasions over the last thirty years have been when yields have fallen back proximate to the mirror of the cycle.
Has it been beneficial? We'll save that nuanced argument for the historians, but do believe it demonstrates quite clearly the nature versus nurture aspect of the Treasury market. The Fed may find efficacy with the cattle prod at times, but the herd of the largest security market in the world will still closely follow the inherent migration pattern - one that many analysts, pundits and traders have attempted to call an audible from over the years.
3rd party Ad. Not an offer or recommendation by Investing.com. See disclosure
here or
remove ads
.
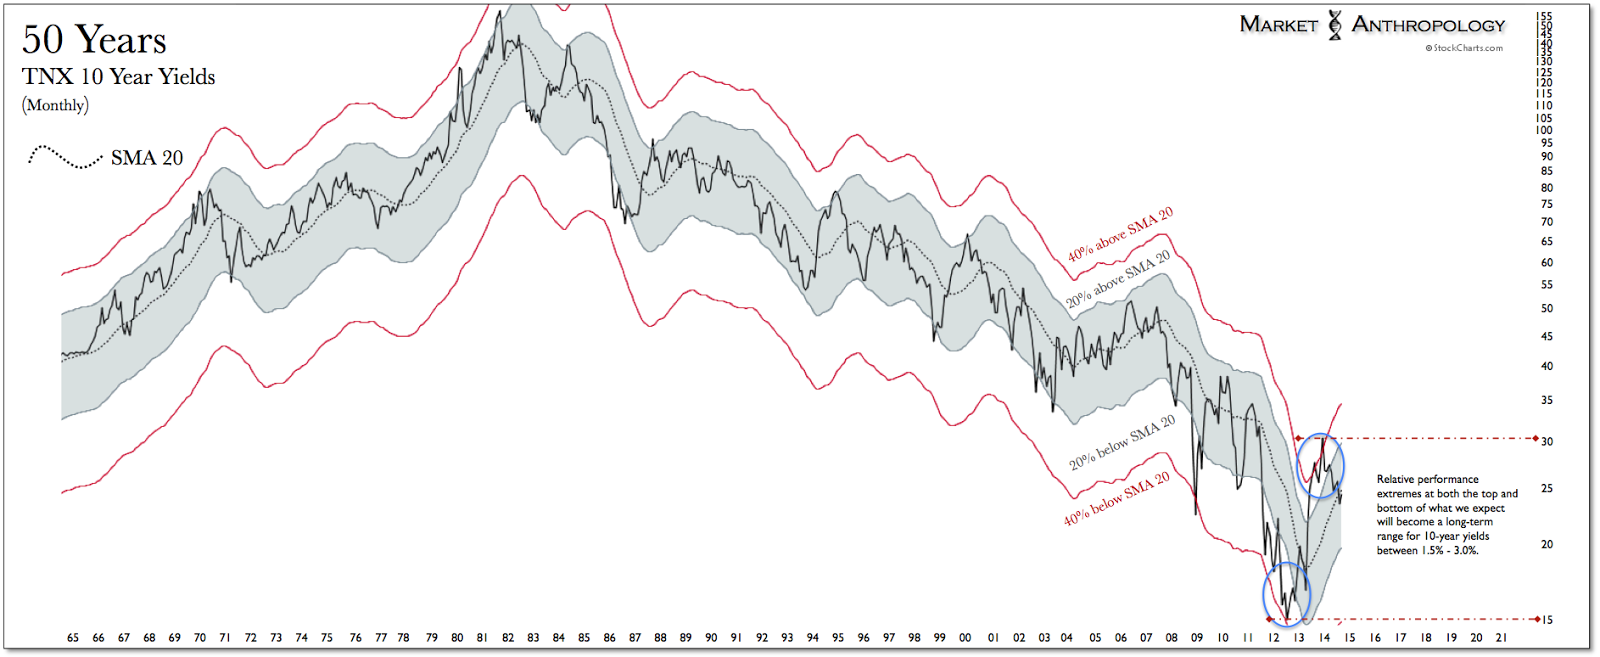
Coming into this year, we had looked for the taper-tantrum squeeze in 10-year yields to reverse from the relative extreme punctuated at the end of last year. The irony being, the collective wisdom in the market in late December and early January was wrestling with how different markets would cope with a rising rate environment. and were left for dead. Emerging markets were viewed as a fashion craze of the previous cycle, but unwearable in a rising rate environment. China? You must be crazy, we were told. Utility stocks? They'll strongly underperform.
Lost on most was the fact that 10-year yields had surged over 80% higher in only a few short months, eclipsing the entirety of influence on long-term yields of the previous rate tightening cycle (~70%) and roughly doubling the effects of the surprise tightenings by the Fed from 1994 through February of 1995. Not surprisingly, it was a great time to buy long-term Treasuries, gold and precious metals miners, emerging market and Chinese equities and utilities.
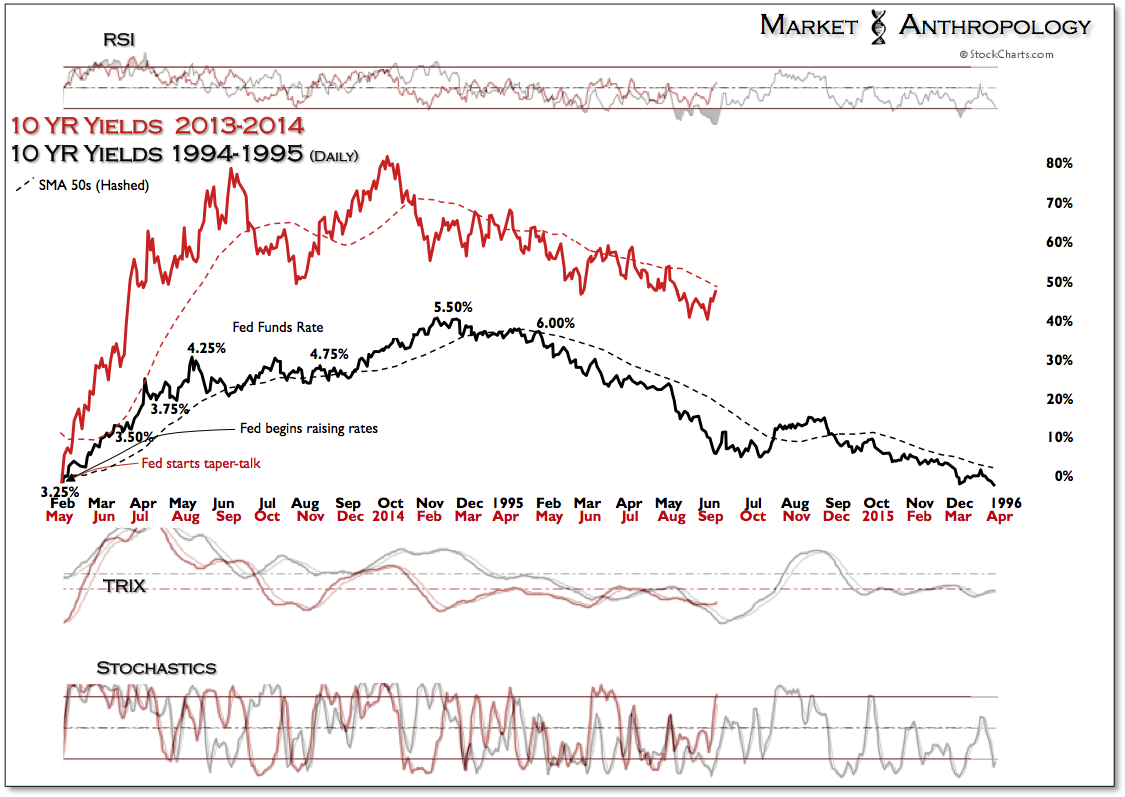
With 10-year yields rising the most since the first week in June, bond bears started sticking their heads outside their caves last week, looking to feed and remind us once more that investing in Treasuries is akin to swimming in gasoline in a lightening storm. Emboldened by comments from Appaloosa Management's David Tepper, declaring, "
It's the beginning of the end of the bond market bubble", the bond bears gain a credible ally and spokesman just as the Fed looks to shut down their country kitchen this fall - as the ECB notifies us of their own grand opening that same month. Exquisite - or desperate, timing we wonder?
While Tepper's reputation and fortune have very much been built on the former, more than a tinge of the later comes to mind - with respect to the severe structural limitations of the European condition and the modest proposal the program will begin with. With that said, it is the thought that counts and we can't deny that Draghi is at the very least forging a reputation of delivering the goods - whatever they may be.
Although we don't believe that the bond market is in a bubble per se, over the last two years we would agree that the Treasury market has been going through a transition of the beginning of the end of the move that began over 30 years ago. The main difference is we don't expect yields to sustain a pivot higher, but remain in a long-term range roughly between 1.5 and 3.0 percent over the next several years, as the markets wrestle with normalization of monetary policy from the extraordinary measures enacted over the past five years. To that end, we defer to history and the over 70 year patterned memory of the cycle, which points to Yellen's patient refrain of lower - longer.
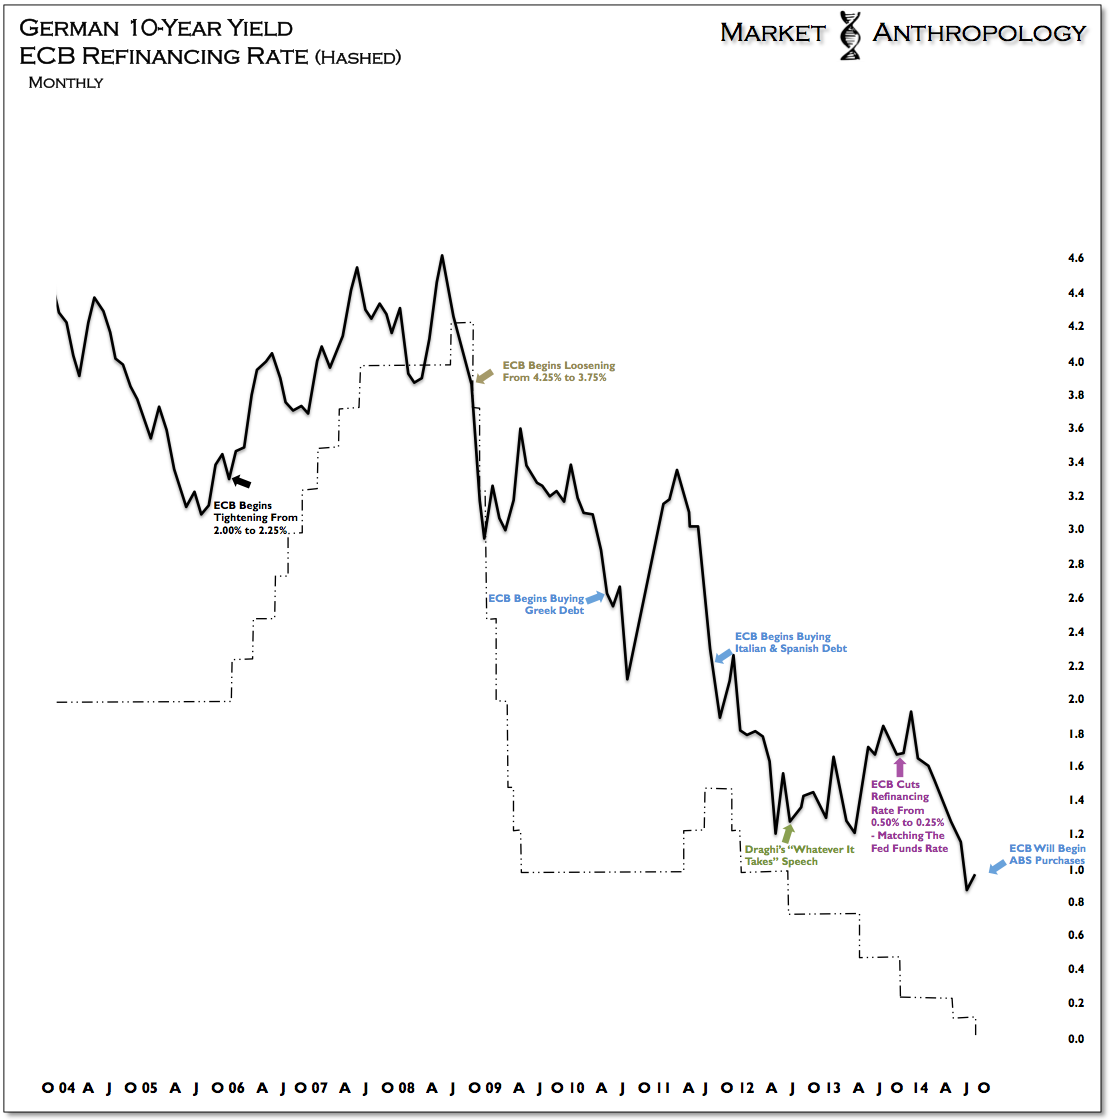
In the obvious sense, the timing of the ECB announcement appears tailored to mitigate the swift collapse in yields that occurred at the end of the two previous QE salvos, as investors' apprehensions without the Fed's training wheels and soup kitchen took over. While conventional market wisdom infers that QE helps a central bank put a cap on yields, as we mentioned earlier, the evidence in the market is very much to the contrary. QE by all accounts has successfully stimulated participants away from the safe-haven shores of Treasuries and into riskier assets.
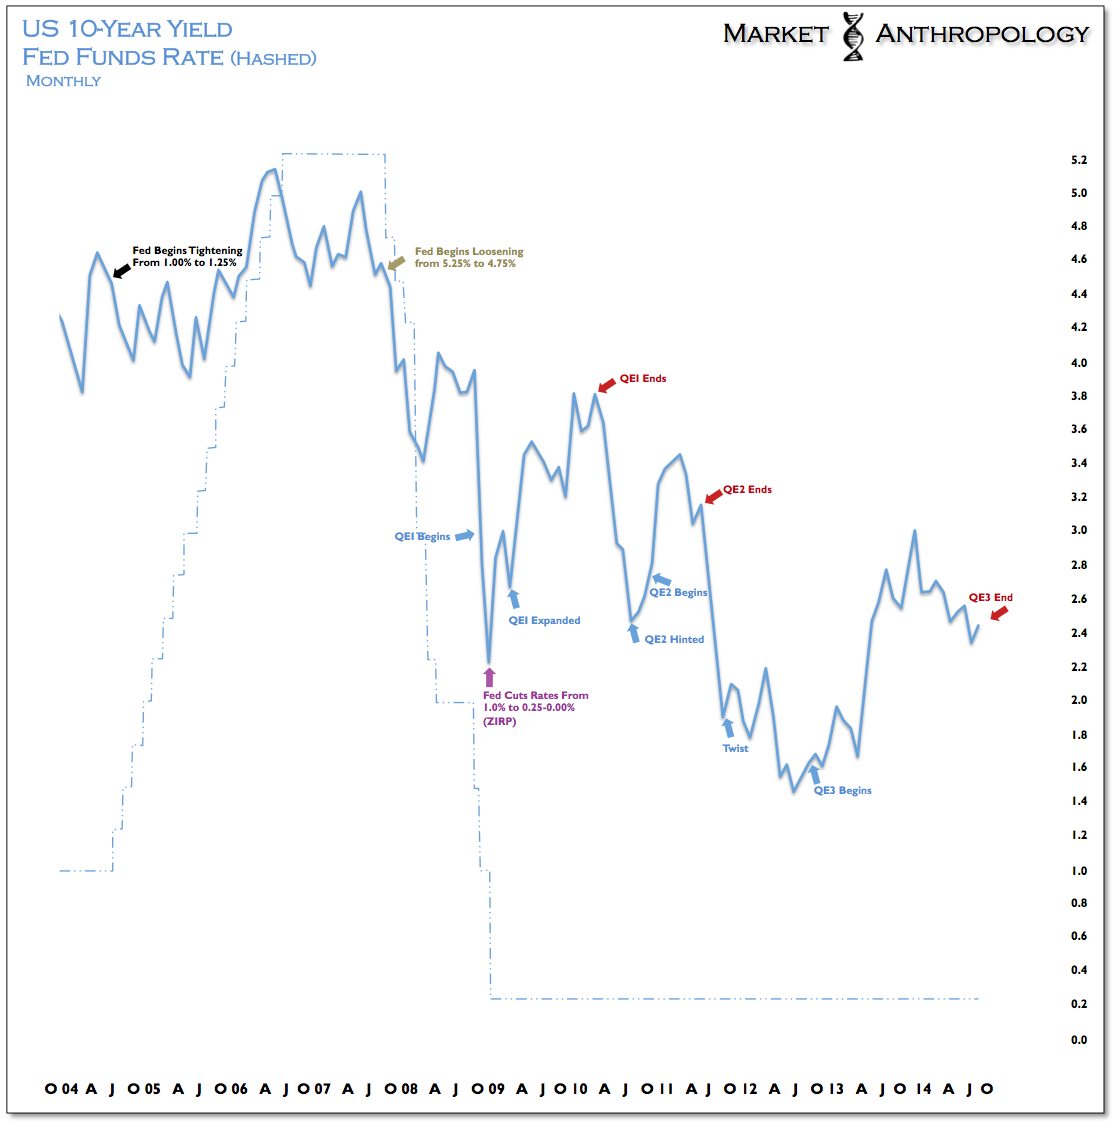
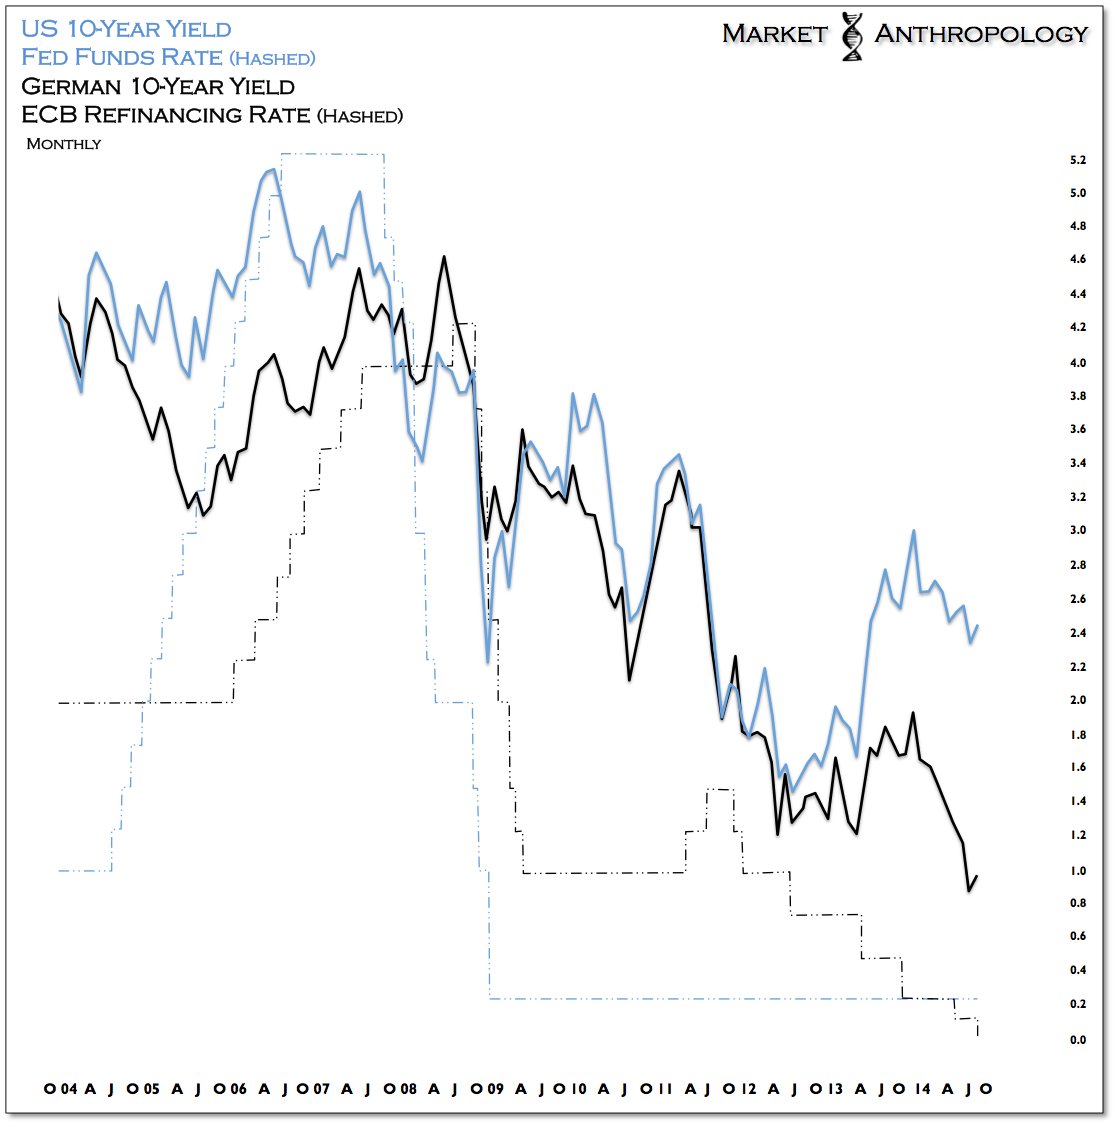
When the Fed started tightening, first in the summer of 2004, US 10-year yields diverged higher, away from Europe. As shown below in the chart comparing US and German yields, it wasn't until the financial crisis took hold in the back half of 2008 that the two markets once again converged. Maintaining its leadership role in dictating broader monetary policy direction, US yields fell below Europe in the fall of 2008, just as the Fed cut swiftly towards the lower bound of the fed funds rate. Reaching the bottom in December of that year, the ECB would take its time over the next five years, meeting the Fed just last November.
Propelled by the cattle prod of QE3 and the threat of the taper last spring, US 10-year yields have diverged considerably from Germany - Europe's strongest economy, as the ECB has continued to cut below where the Fed funds rate currently resides. As our last bunch of QE biscuits warm, and with the ECB finally pulling a page from our own quantitative cookbook, it seems reasonable to suspect that the spread between the US and Germany will begin to come in soon.
The question we suppose, is where the next convergence might take place: higher or lower than where US yields currently reside? Will US yields enjoy support extended from the new European initiative, or will nature exert its influence over the cycle and cause them to meet lower at a later date?
Longer term, our money is still on the latter and from a relative performance point of view, we continue to favor long-term Treasuries relative to equities today. From our perspective, Tepper's audible will meet the same fate as the many quarterbacks who have made the call over the years. Sacked behind the line of scrimmage.
3rd party Ad. Not an offer or recommendation by Investing.com. See disclosure
here or
remove ads
.


