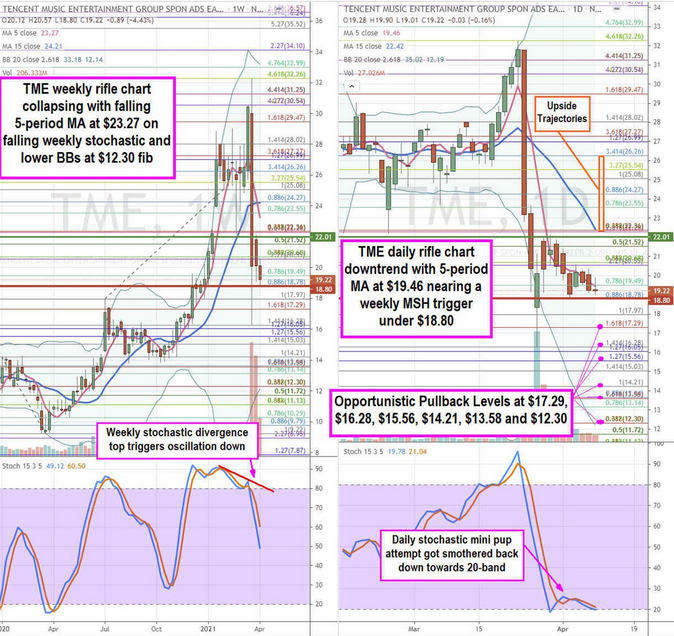
Chinese online music platform Tencent Music Entertainment Group (NYSE:TME) stock surged to highs of $32.25 on Mar. 23, 2021, before collapsing nearly in half to a low of $16.31 just three days later. Massive selling also occurred in ViacomCBS (NASDAQ:VIAC) and Discovery Networks (NASDAQ: DISCA) and various Chinese stocks including Baidu (NASDAQ:BIDU), Tencent, Vipshop (NYSE: VIPS), and iQIYI (NASDAQ:IQ).
News emerged that these stocks experienced selling due to the massive forced liquidation of stocks in the Archegos Capital Management portfolios due to margin calls. These stocks shares losses ranging from 30% to 60% in a matter of days with contagion fears spreading among peer stocks and investment banks. However, the benchmark index rallies to all-time highs alleviated concerns in the near-term. While the bulk of the selling may have been completed, shares are still struggling with the overhang and may continue lower. High-risk tolerant investors considering taking exposure into China’s most dominant online music platform can monitor for deep opportunistic pullback levels to consider scaling into a position.
Tencent Music Domination
The growth of Tencent Music’s business and market share is impressive. The Company has amassed an 88% market share of China’s online music market. Tencent owns three of the top five mobile music apps including Kogu Music, Kuwo Music and QQ Music with over 600 million total users in China. The online music market continues to grow as the average listening time for users grew from 80-minutes in 2018 to nearly 2.6 hours per day in 2020. T
he Company also signed a digital rights distribution agreement with Universal Music in addition to Warner Music and Sony (NYSE:SONY) Music Records. The closest competitor NetEase (NASDAQ:NTES) only has a quarter of Tencent’s monthly active users (MAUs). The network effect generated from its parent company Tencent is the key competitive edge as Tencent Music gains from an existing massive database of users. For example, integrating QQ Music in the Tencent Holdings owned WeChat 8.0 app enables users to seamlessly create and share short-form music and videos with friends. The Company also enjoys a symbiotic relationship with Spotify (NYSE:SPOT) by owning a 2.3% stake in SPOT while Spotify is the second largest equity holder with an 8.4% interest in TME. Parent company Tencent Holdings is the largest holder of TME with a 55.6% stake.
China Crackdown
Unfortunately, the dominant position of Tencent Music can also be its downfall with the Chinese government. Chinese regulators are also cracking down on Companies getting too big exhibiting what it deems as monopolistic practices. Parent company Tencent Holdings (OTC:TCEHY) could be the next target after investigating Alibaba Group (NYSE:BABA). Further scrutiny over data and privacy issues and censorship is a dangerous fuse that could invite more clamp down on social entertainment platforms.
U.S. Relations and HFCA Act
The Biden administration and the U.S. Congress is taking note of the potential threat of China’s domination of various supply chains and raw materials, security threats, and human rights violations. They are more prone to take a hard line stance which could once again erupt in a trade war amidst contemptuous relations. The SEC is also pursuing the Holding Foreign Companies Accountable (HFCA) Act which seeks to delist companies from U.S. exchanges that are owned or controlled by foreign governments. This law was created with China in mind during the Trump administration. The irony is that only Chinese citizens are legally allowed to own shares in Chinese companies, therefore, most U.S. listed Chinese stocks are actually pass-through entities based off shore in the Cayman Islands. Up to now, the Chinese government has looked “the other way” on this loophole. The once impossibility of this loophole ever being plugged wasn’t even an after thought a decade ago, but now is a different environment.

TME Opportunistic Pullback Levels
Using the rifle charts on weekly and daily time frames provides a near-term view of the landscape for TME stock. The weekly rifle chart uptrend peaked at the $32.26 Fibonacci (fib) level. The subsequent collapse to the $16.28 fib occurred in the same weekly candle as the weekly stochastic triggered a divergence top plunging it to the 50-band. The weekly 5-period moving average (MA) crossed the 15-period MA down and continues to fall at $23.27. The daily rifle chart breakdown has a falling 5-period MA at $19.46 with lower Bollinger Band (BBs) near the $12.30 fib. The daily stochastic attempted to form a mini pup bounce attempt a market structure low (MSL) buy trigger above $22.01 but the rejection caused it to cross back down towards the 20-band. The weekly market structure high (MSH) sell triggers under $18.80. High risk-tolerant investors can look for opportunistic pullback levels at the $17.29 fib, $16.28 fib, $15.56 fib, $14.21 fib, $13.58 fib, and the $12.30 fib. Upside trajectories range from the $22.26 fib to the $26.26 fib. Keep an eye on peer Chinese internet stocks BIDU and VIPS.
