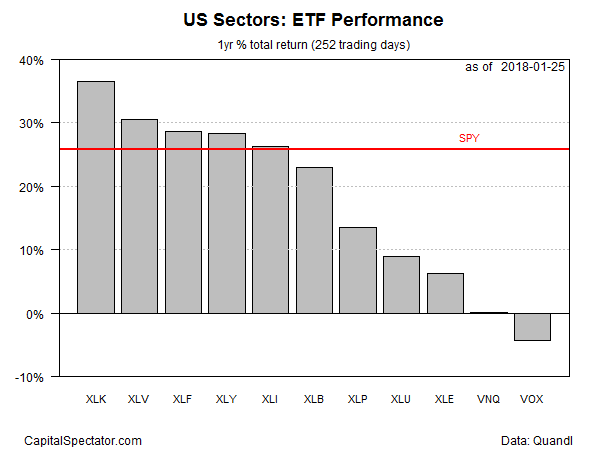
Shares of technology stocks remain the trend leader but healthcare’s recent strength suggests a changing of the guard may be near, based on a set of sector ETFs ranked by one-year return. Meanwhile, telecom is the only US sector nursing a loss for the year-over-year change, although real estate stocks are close to dipping into negative terrain.
Technology Select Sector SPDR (NYSE:XLK) continues to deliver the dominant performance for US sectors via the trailing one-year window (252 trading days). The ETF is up a strong 36.4% on a total-return basis through yesterday (Jan. 25). Earlier in the week, the fund was up nearly 40% year-on-year, close to matching its highest one-year advance since the recession ended in 2009. But the fund has stumbled in recent days, opening the door for healthcare, the second-strongest one-year performer, to potentially steal the leadership crown in the weeks ahead.
Health Care Select Sector SPDR (NYSE:XLV) is currently ahead by 30.5% for the year through yesterday, second only to tech. For the year so far, however, XLV’s red-hot performance has overtaken tech. Month to date, XLV is up 8.4% vs. 6.5% for XLK.
All but one of the major sector ETFs are posting gains for the one-year trend. The one exception at the moment: telecom. Vanguard Telecommunication Services (NYSE:VOX) has slipped 4.3% over the past 12 months – no mean feat in a roaring bull market for stocks generally. The second-worst performer — real estate investment trusts (REITs) — is just barely ahead for the year, although the recent weakness in Vanguard REIT (VNQ) suggests a second sector may soon tip over to the dark side on a trailing 12-month basis.
The broad market trend, by contrast, is solidly positive. SPDR S&P 500 (MX:SPY (NYSE:SPY)) is up 25.8% for the year through yesterday.

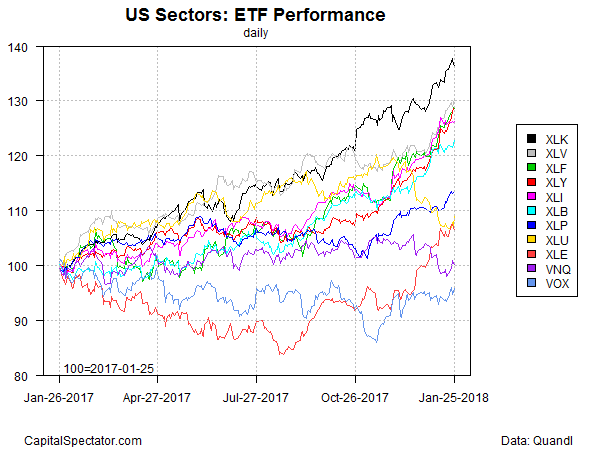
Tech’s dominance in recent history is conspicuous in the performance chart below. XLK’s bull run (black line at top of chart) contrasts sharply with VOX’s slow decline (light blue line at bottom) over the past year.

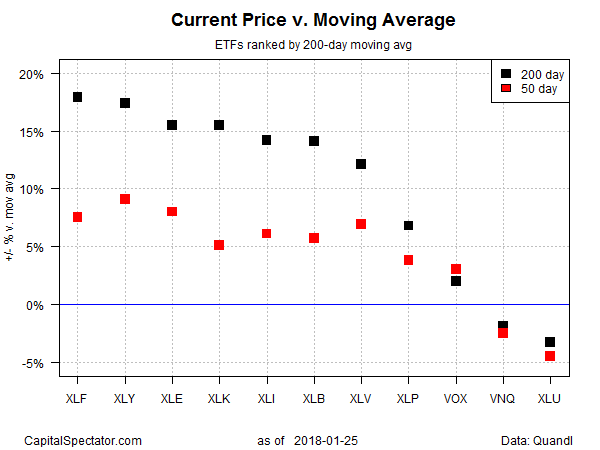
Ranking the sector ETFs by current price relative to 200-day moving average offers a different perspective on leadership with financials taking the top spot. Financial Select Sector SPDR (NYSE:XLF) closed yesterday at close to an 18% premium over its 200-day average, edging out the second-hightest premium – 17.4% for Consumer Discretionary Select Sector SPDR (NYSE:XLY)).

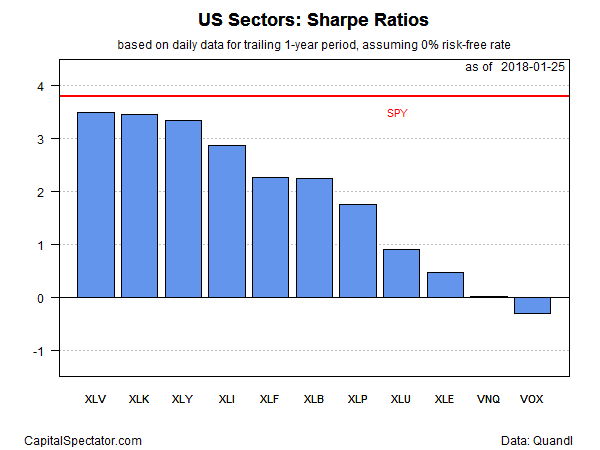
Ranking one-year returns on a risk-adjusted basis gives healthcare a slight edge over the rest of the field. XLV’s 3.5 annualized Sharpe ratio is fractionally ahead of tech’s 3.4. Note, however, that the broad stock market’s risk-adjusted performance leads all the sectors via SPY’s stellar 3.8 Sharpe ratio for the trailing one-year period. In short, the equity market overall has delivered an incomparable mix of high return and low volatility.

