Get 40% Off
👀 👁 🧿 All eyes on Biogen, up +4,56% after posting earnings. Our AI picked it in March 2024.
Which stocks will surge next?
Unlock AI-picked Stocks

Technicals: SPX, Gold And Miners

Published 01/25/2017, 12:24 PM
Updated 07/09/2023, 06:31 AM
  • SPX Monitoring purposes; Covered 12/30/16 at 2238.83= gain .46%; Short on 12/29/16 at 2249.26.
  • Monitoring purposes Gold: Long GDX on 12/28/16 at 20.25.
  • Long-Term Trend monitor purposes: Short SPX on 1/13/16 at 1890.28
  • SPDR S&P 500

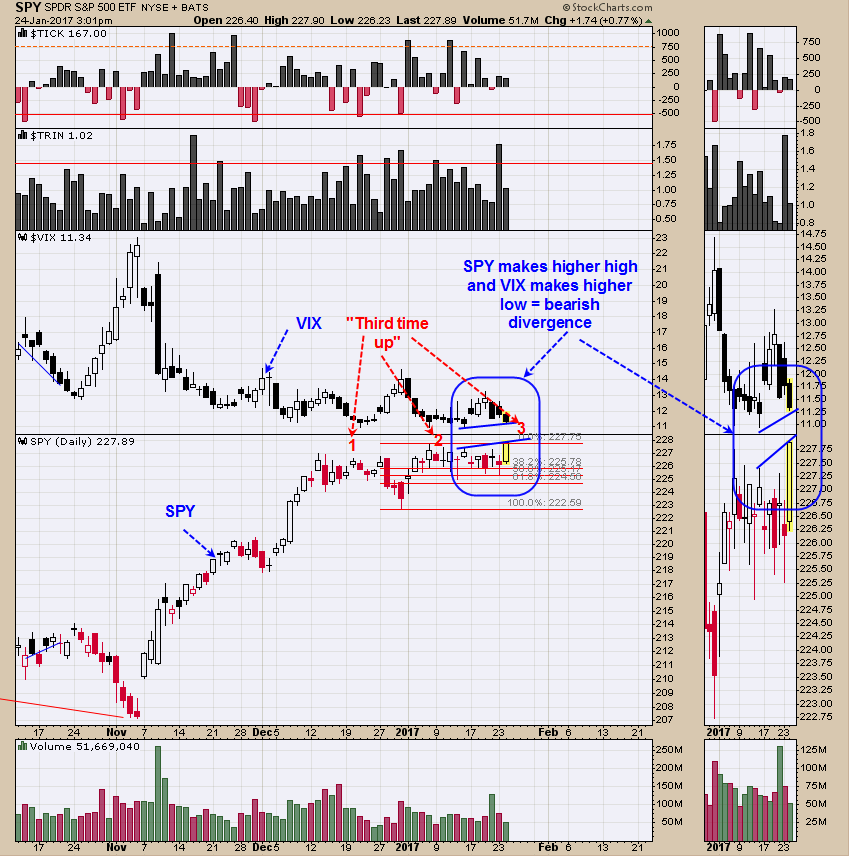
    Today the SPY (NYSE:SPY) pushed to a new short term high and the VIX made a higher low, setting up a divergence. This divergence will go away if the SPY continues higher and the VIX breaks to a new low. Notice that the SPY is making a third time higher since December. This “Third time up” could be a “Three Drives to Top” pattern which would have a minimum downside target to where the pattern began (in this case a decline to 223 on the SPY). The TRIN and TICKS should develop a bearish setup if indeed the market is heading into a top. Notice that it took a little over two weeks for each of the miner two previous highs to develop and there is symmetry in markets and may take this potential “Third high” two weeks also and give a target near February 7 to complete the third top. We also talked about the DJI getting over 20K before at top is realized and the DJI hasn’t reached that level yet. Covered 12/30/16 at 2238.83 = gain .46%; Short on 12/29/16 at 2249.26.
    Volatility

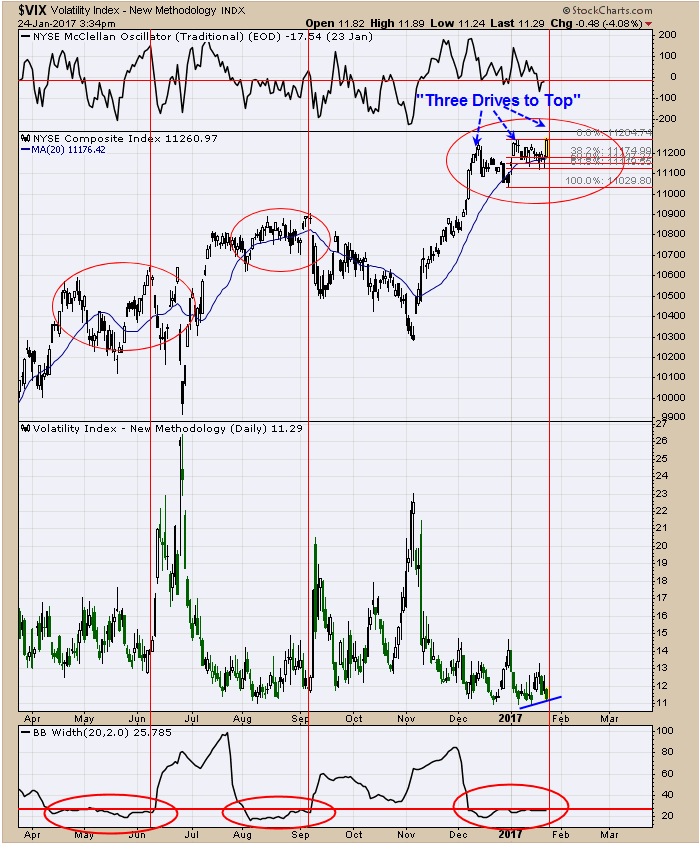
    The bottom window is the Bollinger® Band Width. As you can see the Bollinger Band Width has stayed below 30 since mid December and the previous two times when this developed the market was not far from a top. With the Bollinger Band Width staying this long below 30 suggests another top is nearing. While the “Three Drives to Top” on the SPY may not meet all the requirements the NYSE Composite is fulfilling these requirements and when the NYSE Composite tops so will the SPY. We are thinking one of the triggers for a top is for the DJI to close above 20K. Staying neutral for now.
    Gold Miners Bullish Percent Index

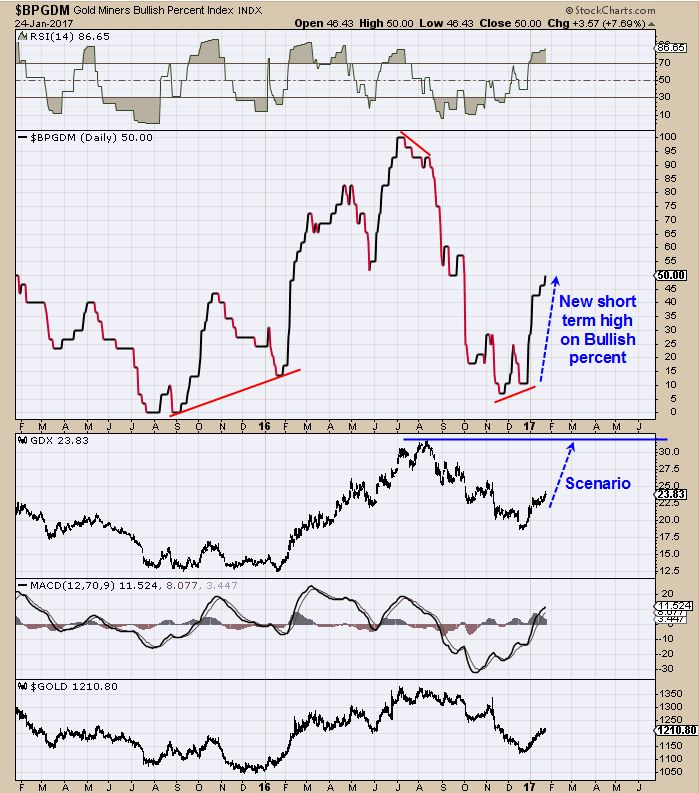
    The above chart is the bullish percent index for the Gold Miners index. The bullish percent index measures the percent buy signals generated by the point and figure method. Last week the Bullish Percent index stood at 46.43% of the stocks in the Gold Miners index where on Point and Figure buy signals. This week jumped up to 50% buy signals on stocks in the Gold Miners index showing this index is still getting stronger suggesting this rally is not done. The most like target is the previous high on GDX which is up near 31.00 range. This target may change as the situation changes. Long GDX on 12/28/16 at 20.25. For examples in how "Ord-Volume" works, visit www.ord-oracle.com.

3rd party Ad. Not an offer or recommendation by Investing.com. See disclosure here or remove ads .

Latest comments

Thanks for providing the $BPGDM. I use the $BPNYA. Great way track tops, bottoms and momentum for Gold Miners and NYSE. Useless for Day Traders. But great for longer term trend traders
Risk Disclosure: Trading in financial instruments and/or cryptocurrencies involves high risks including the risk of losing some, or all, of your investment amount, and may not be suitable for all investors. Prices of cryptocurrencies are extremely volatile and may be affected by external factors such as financial, regulatory or political events. Trading on margin increases the financial risks.
Before deciding to trade in financial instrument or cryptocurrencies you should be fully informed of the risks and costs associated with trading the financial markets, carefully consider your investment objectives, level of experience, and risk appetite, and seek professional advice where needed.
Fusion Media would like to remind you that the data contained in this website is not necessarily real-time nor accurate. The data and prices on the website are not necessarily provided by any market or exchange, but may be provided by market makers, and so prices may not be accurate and may differ from the actual price at any given market, meaning prices are indicative and not appropriate for trading purposes. Fusion Media and any provider of the data contained in this website will not accept liability for any loss or damage as a result of your trading, or your reliance on the information contained within this website.
It is prohibited to use, store, reproduce, display, modify, transmit or distribute the data contained in this website without the explicit prior written permission of Fusion Media and/or the data provider. All intellectual property rights are reserved by the providers and/or the exchange providing the data contained in this website.
Fusion Media may be compensated by the advertisers that appear on the website, based on your interaction with the advertisements or advertisers.
© 2007-2024 - Fusion Media Limited. All Rights Reserved.