Join +750K new investors every month who copy stock picks from billionaire's portfoliosSign Up Free

Technicals Net Bullish Across Indices

Published 05/05/2017, 12:08 AM
Updated 07/09/2023, 06:31 AM
US500
-
US2000
-
IXIC
-
SOX
-

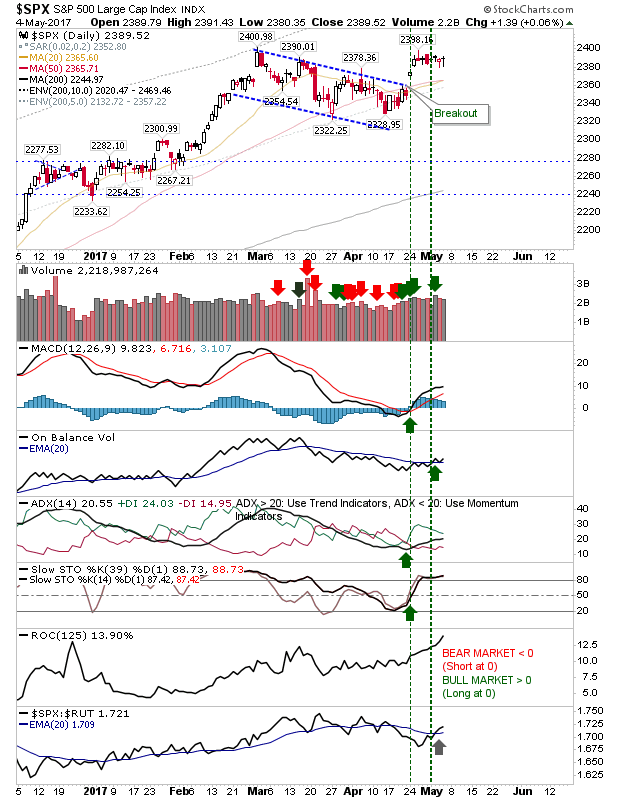
All lead indices are net bullish in technical strength as markets consolidated last week's gains. The S&P has posted a series of doji/hammer after emerging from a bullish 'flag' / downward channel.

SPX Daily Chart


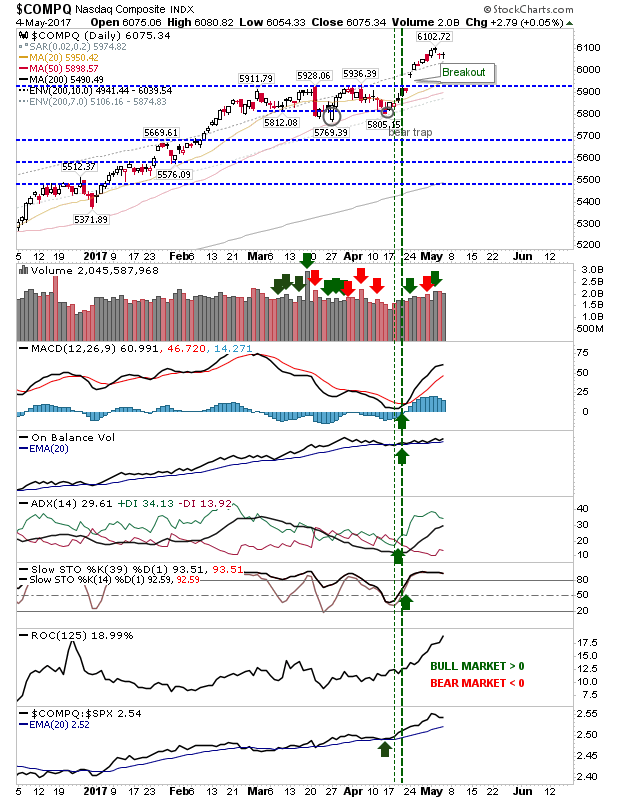
The NASDAQ gapped down Wednesday but held its ground in another narrow day of trading. Relative performance ticked down after significant outperformance against the S&P, but it still remains ahead of Large Cap stocks.
COMPQ Daily Chart

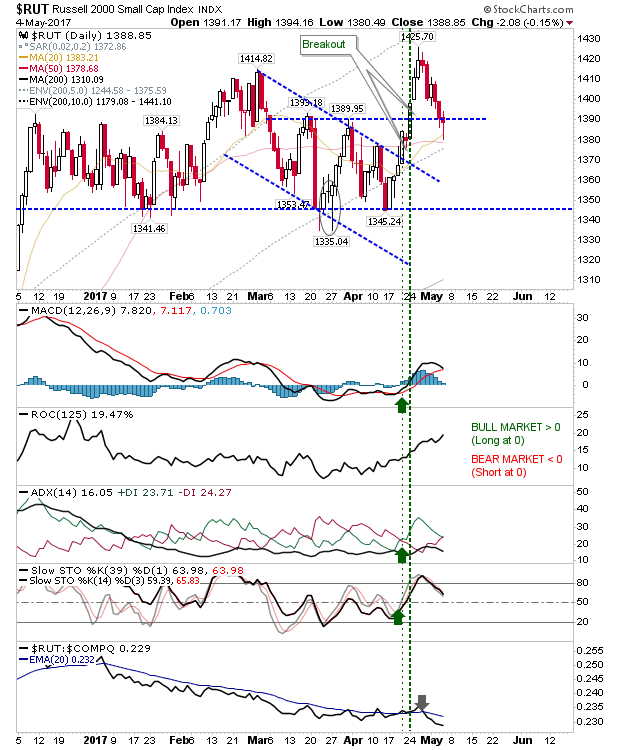
The Russell 2000 was on course to register the third day of losses in a row, but it did enough to come back to newly minted breakout support around 1,390. Technicals are still bullish, although +DI/-DI is about to generate a negative/bearish crossover.
RUT Daily Chart

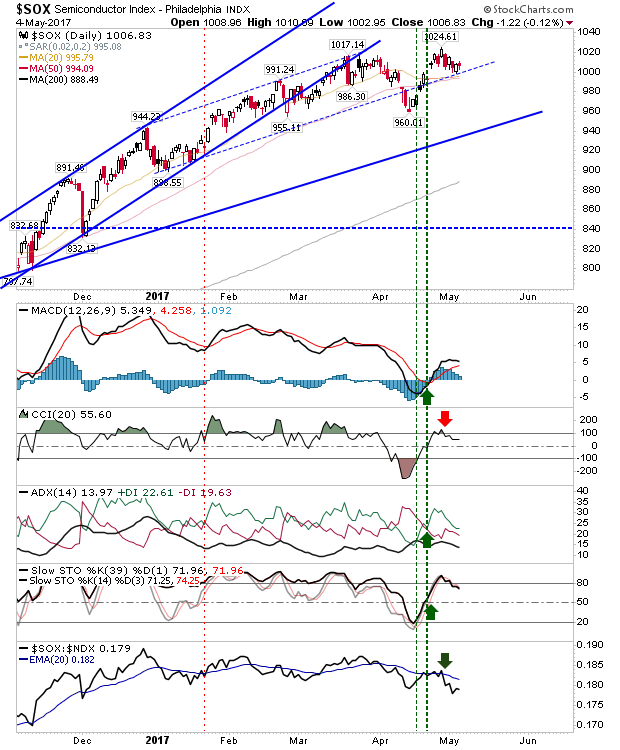
The Semiconductor Index is coming back off a retest of highs in what may become a double top, although a loss of 960 would be required to confirm. In the meantime, the index sits on what was former channel support with technicals easing lower – although such technicals look ready to accelerate down which may be the lead action for a loss of 960.
SOX Daily Chart

For Friday, shorts may have something to play for in the Semiconductor Index with a stop above 1,025. The Russell 2000 might go the other way; downside action looks to be tiring and the presence of support may be the kicker to start a new rally. Watch these indices closely over the next couple of days.

Latest comments

Loading next article…
Risk Disclosure: Trading in financial instruments and/or cryptocurrencies involves high risks including the risk of losing some, or all, of your investment amount, and may not be suitable for all investors. Prices of cryptocurrencies are extremely volatile and may be affected by external factors such as financial, regulatory or political events. Trading on margin increases the financial risks.
Before deciding to trade in financial instrument or cryptocurrencies you should be fully informed of the risks and costs associated with trading the financial markets, carefully consider your investment objectives, level of experience, and risk appetite, and seek professional advice where needed.
Fusion Media would like to remind you that the data contained in this website is not necessarily real-time nor accurate. The data and prices on the website are not necessarily provided by any market or exchange, but may be provided by market makers, and so prices may not be accurate and may differ from the actual price at any given market, meaning prices are indicative and not appropriate for trading purposes. Fusion Media and any provider of the data contained in this website will not accept liability for any loss or damage as a result of your trading, or your reliance on the information contained within this website.
It is prohibited to use, store, reproduce, display, modify, transmit or distribute the data contained in this website without the explicit prior written permission of Fusion Media and/or the data provider. All intellectual property rights are reserved by the providers and/or the exchange providing the data contained in this website.
Fusion Media may be compensated by the advertisers that appear on the website, based on your interaction with the advertisements or advertisers.
© 2007-2024 - Fusion Media Limited. All Rights Reserved.