Summary
The problems in Latin America continue. Argentina has had issues related to its debt holdings for the last 12 months. After contracting for 11 quarters between 2015-2016, Brazil's economy has been growing at a sub-par annual pace between 0.5% and 1.3% . And now Peru has been thrust into political crisis (emphasis added):
Peru’s dysfunctional and corruption-ridden political system has courted crisis for years, with three of its past presidents under investigation and one dead after shooting himself during his arrest. But matters came to a head when the current president, Martín Vizcarra, confronted the conservative forces controlling Congress and accused them of stonewalling his efforts to fight corruption and pass political reform.
On Monday afternoon, Mr. Vizcarra invoked a constitutional provision that allows him to dissolve Congress and to call new parliamentary elections. Congress responded by suspending him and swearing in Vice President Mercedes Aráoz as the acting head of state, but then later on Tuesday, she declined the opposition’s designation as interim president, Reuters reported.
The above-linked story contains additional information. This does not bode well for investments in this region:
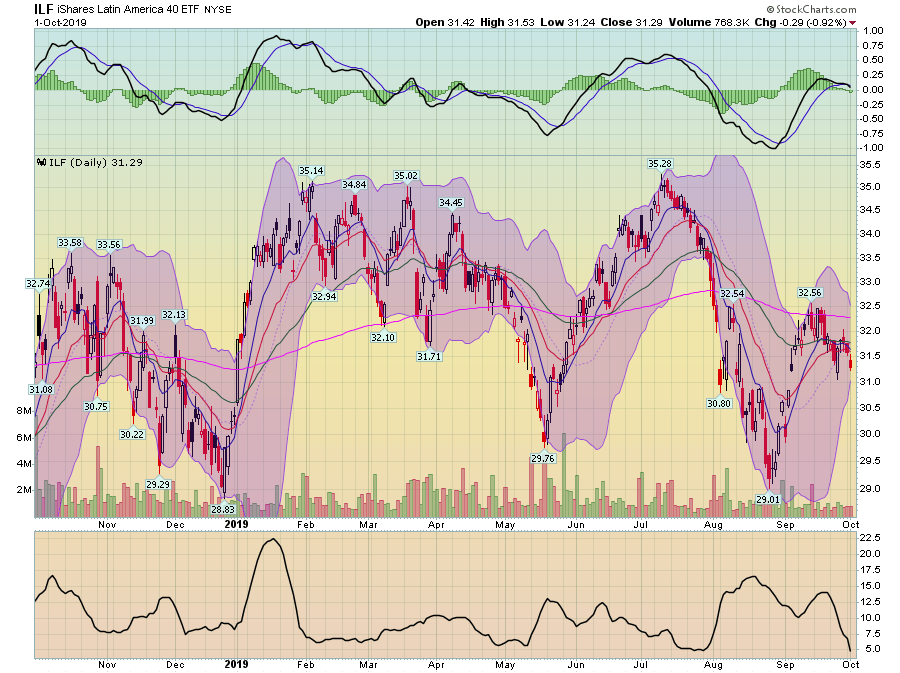
The iShares Latin America 40 ETF (NYSE:ILF) has traded between 29 and 33.5 for the last 12 months. It has spent nine of the last 12 months in a downtrend.
The latest Markit Economics manufacturing data indicated global manufacturing is slowing. While the ASEAN PMI rose marginally from 48.9-49.1, it is still showing a contraction. Production, new orders, export orders, and employment readings all declined. Japan's manufacturing PMI was also lower, falling from 49.3 to 48.9. Output, new orders, exports, and employment were all lower. Finally, the EU PMI reading fell the most, dropping from 47-45.7. The internals sang a familiar refrain: new orders, exports, production, and employment all dropped. This data supports the WTOs recent prediction of lower global trade, highlighted in yesterday's post.
Let's continue looking at some key jobs-related data in anticipation of Friday's employment report. Here are the charts for manufacturing and private service-producing jobs, starting with the former:
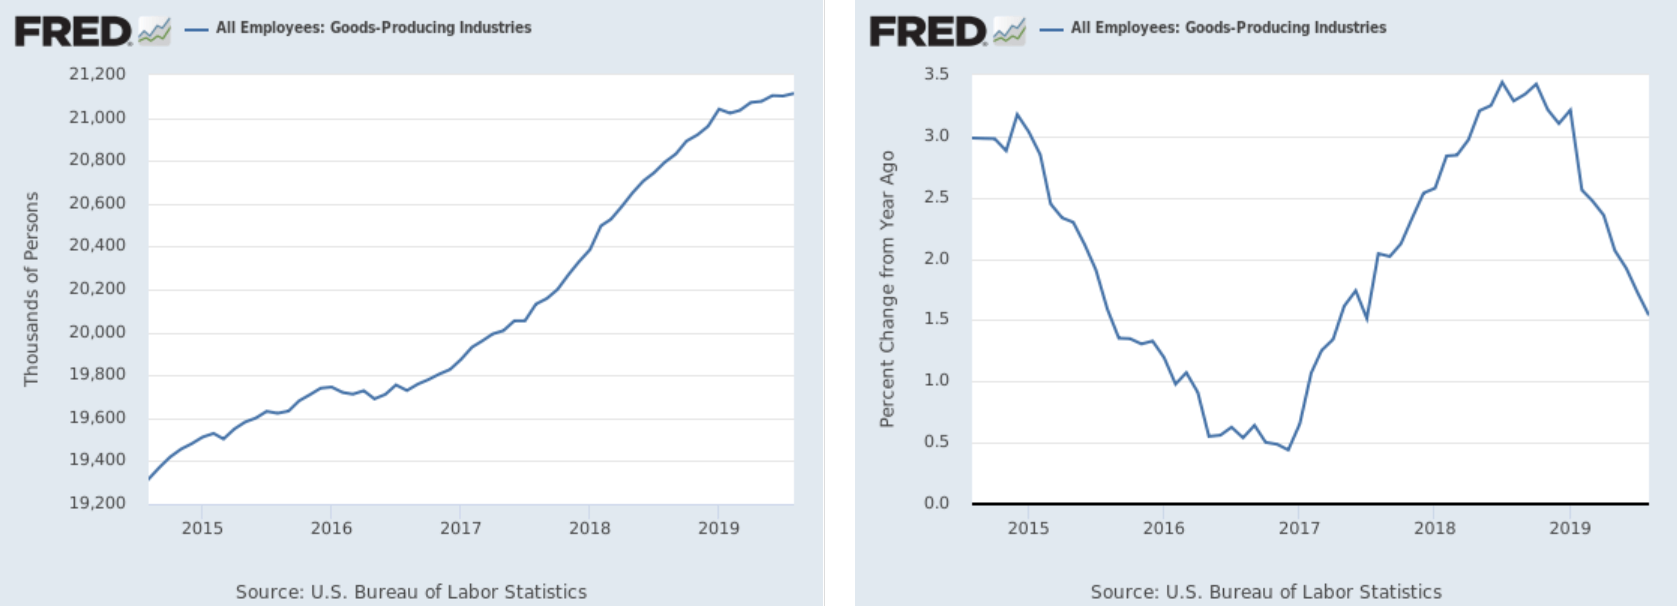
Manufacturing jobs are still growing (left chart) but the pace of Y/Y percentage change is decreasing (right chart).
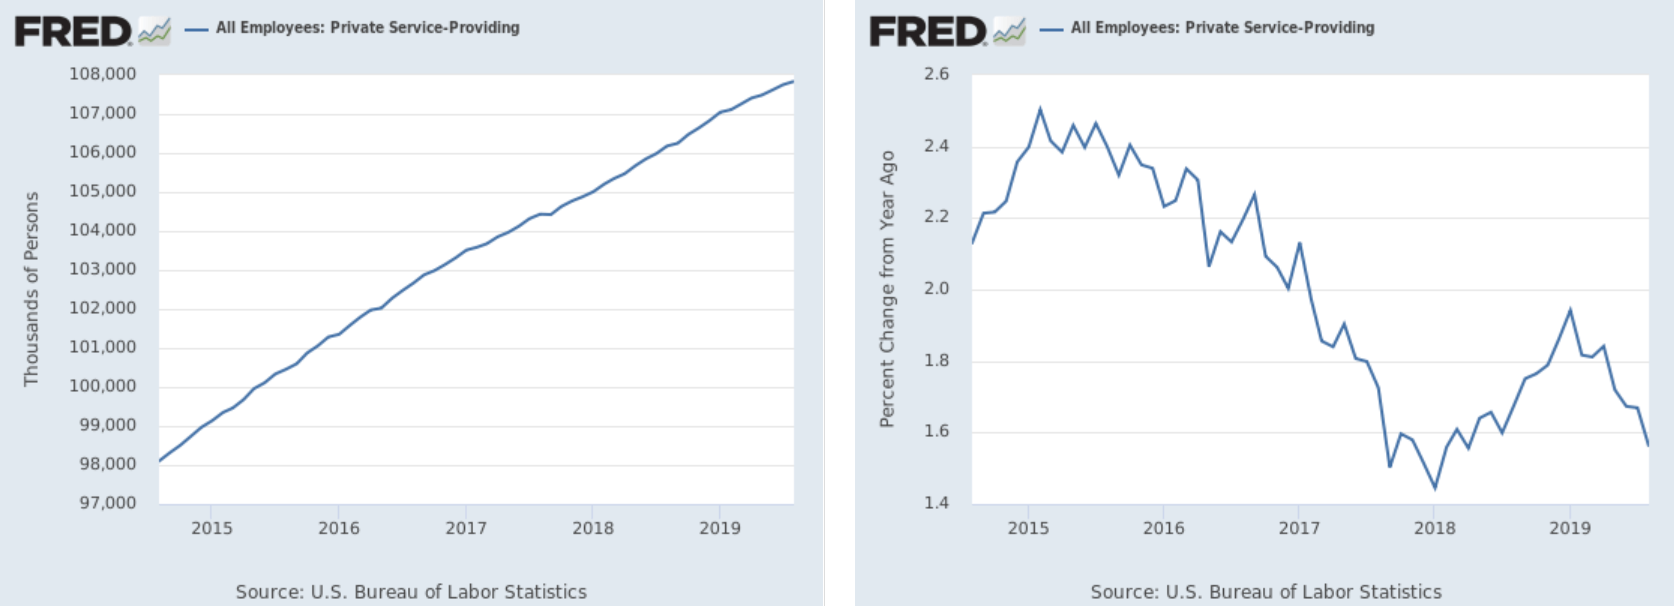
The same pattern is present in the private service-producing data.
The drop in the Y/Y percentage change of growth explains the decline in the moving averages of establishment job growth:
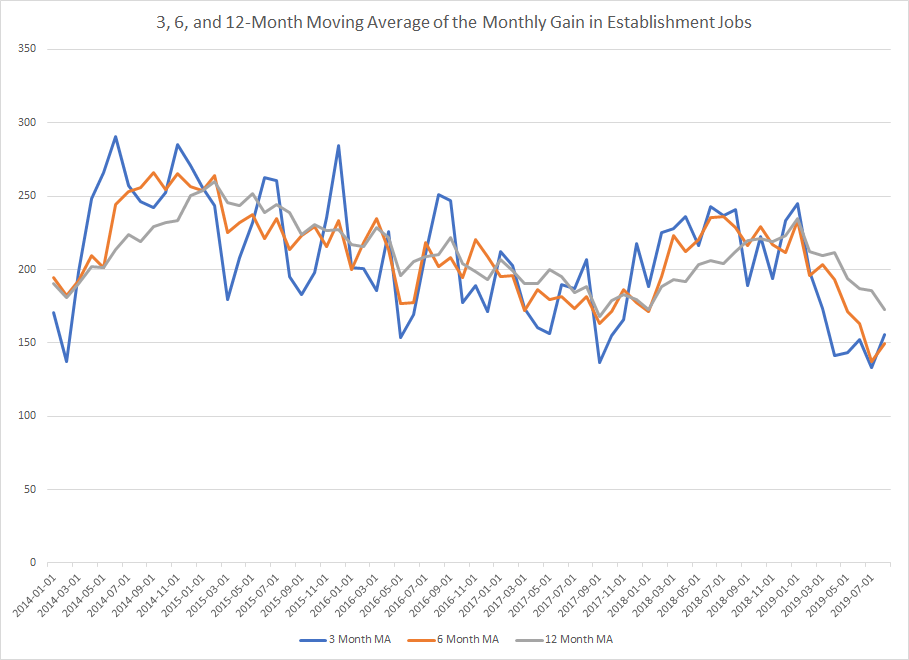
Data from the St. Louis Federal Reserve; author's calculations
The 3-month moving average of establishment job gains (in blue) has been declining since the start of the year. While this measure is volatile and has declined in the last five years, the 6-month moving average (in gold) is currently declining at its fastest pace in the last five years. The recent leveling-off of the 3-month moving average should slow this drop in the next few months.
Let's take a look at today's performance table:
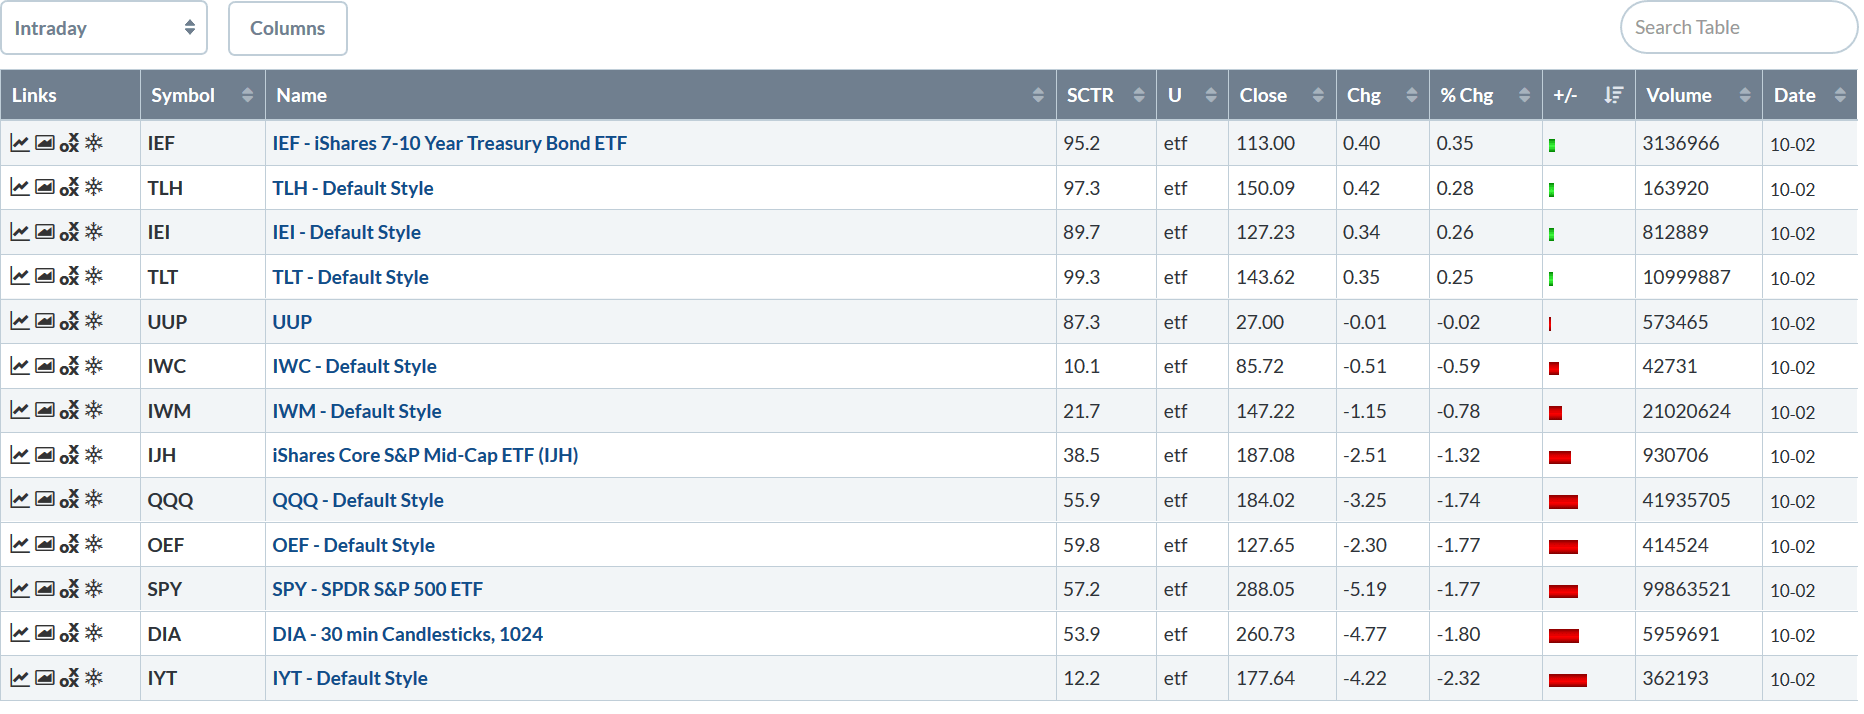
We see the standard pattern we've seen for most of the last six months: Treasuries led the market higher, gaining modestly. Oddly, the smaller-cap indexes were the "better" performers, losing between 0.59% and 1.32%. Larger-cap indexes were down the most.
Over the last 30 days, the equity markets have made a complete round trip. They rallied at the beginning of September but have trended lower since. Today, they hit lows last seen 30 days ago.
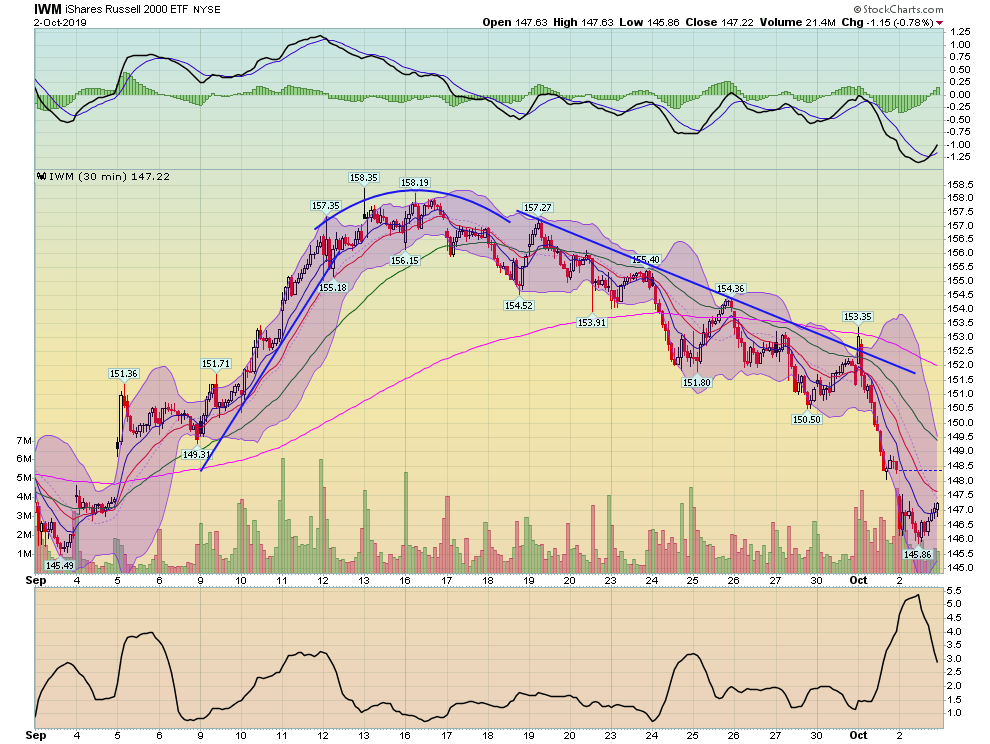
The iShares Russell 2000 (NYSE:IWM) rallied strongly in early September, with prices rising almost 9%. The index formed a rounding top in mid-September and trended lower for the rest of the month. Tuesday, prices dropped sharply and yesterday they gapped lower at the beginning of the session.
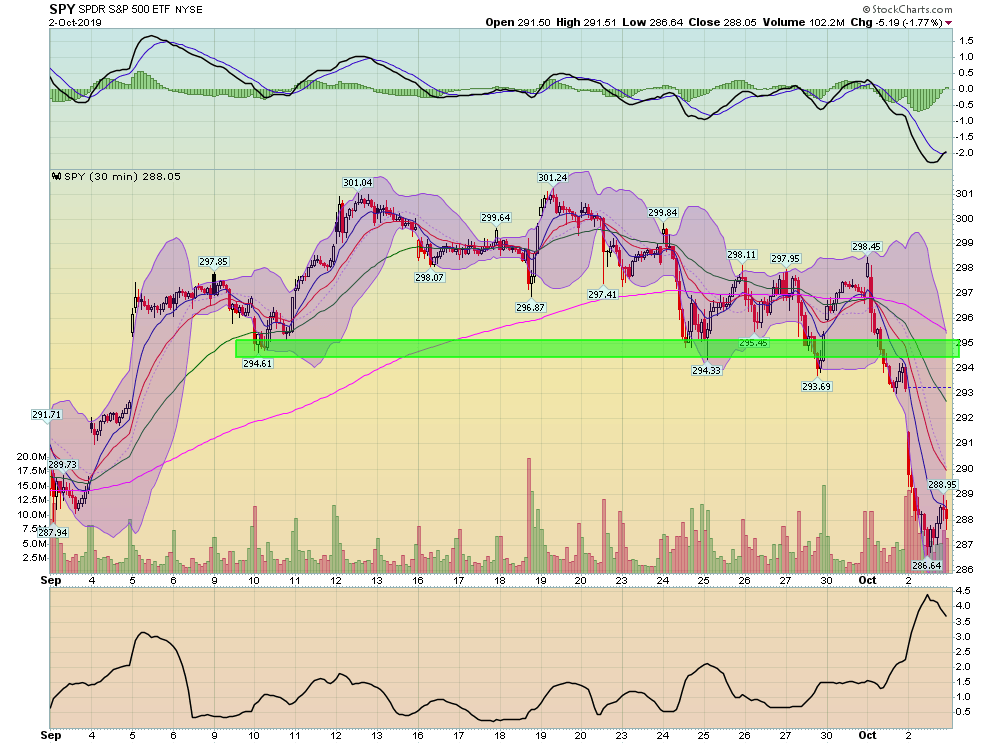
The SPDR S&P 500 (NYSE:SPY) pattern is a bit different: it traded largely sideways for most of the month, using the mid-290s as technical support. Yesterday morning, prices gapped sharply lower. Although the index rebounded during the session, they were still down sharply overall.
Meanwhile, the Treasury market has once again caught a bid:
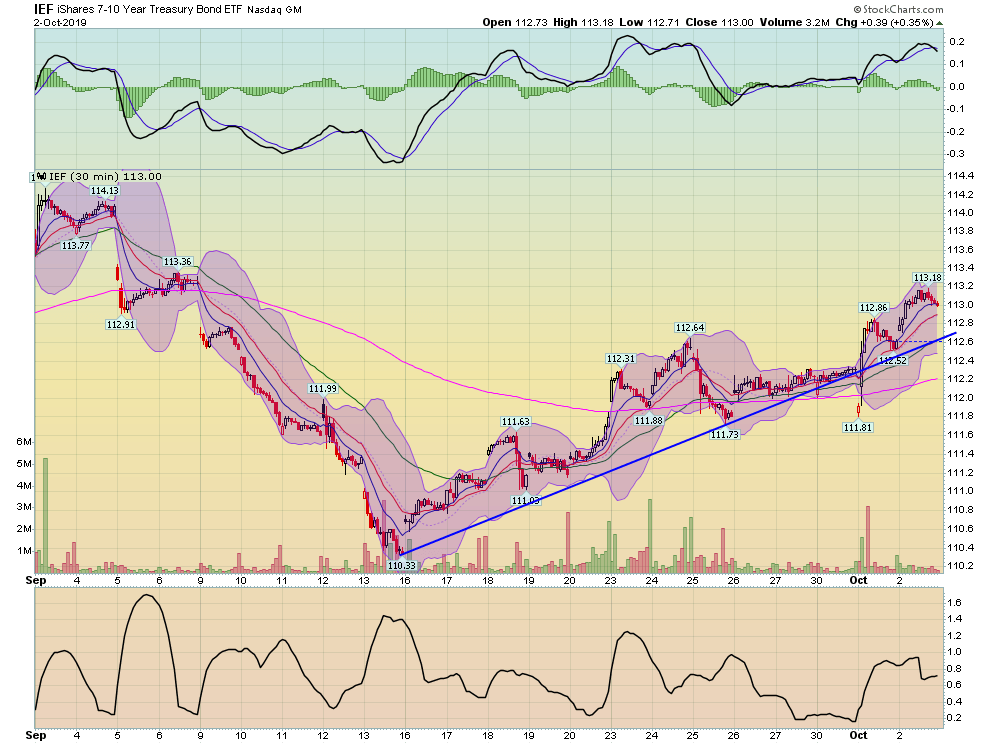
The iShares 7-10 Year Treasury Bond (NYSE:IEF) ETF (NASDAQ:IEF) hit a low in mid-September—right when the markets formed their rounding top. Since then prices have caught a consistent bid. While they have not reached levels from earlier in the month, they have regained about 80% of their losses.
The damage is clear on the daily charts:
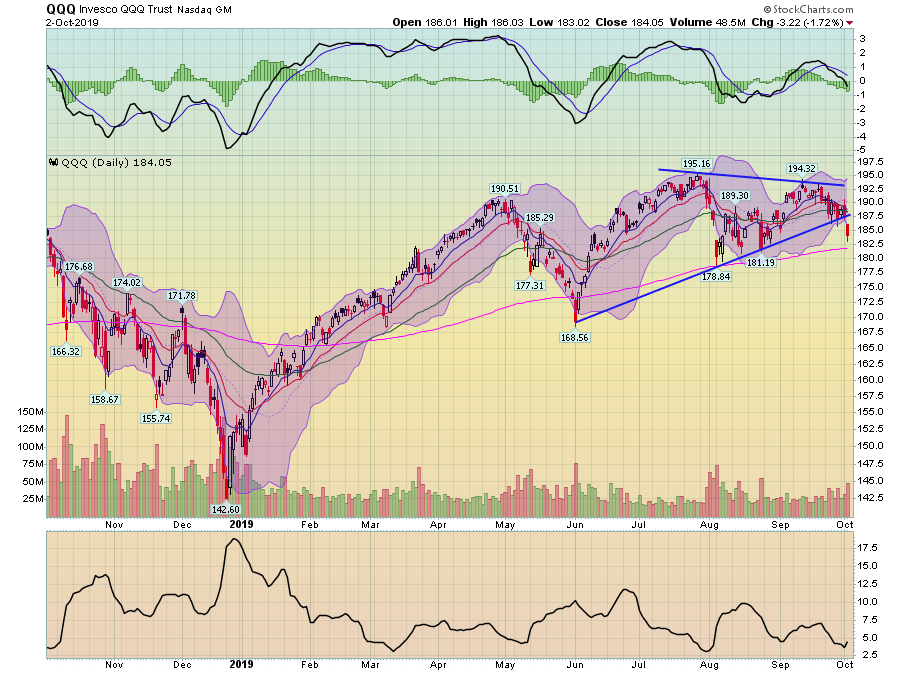
The Invesco QQQ Trust (NASDAQ:QQQ) broke lower yesterday, moving through technical support.
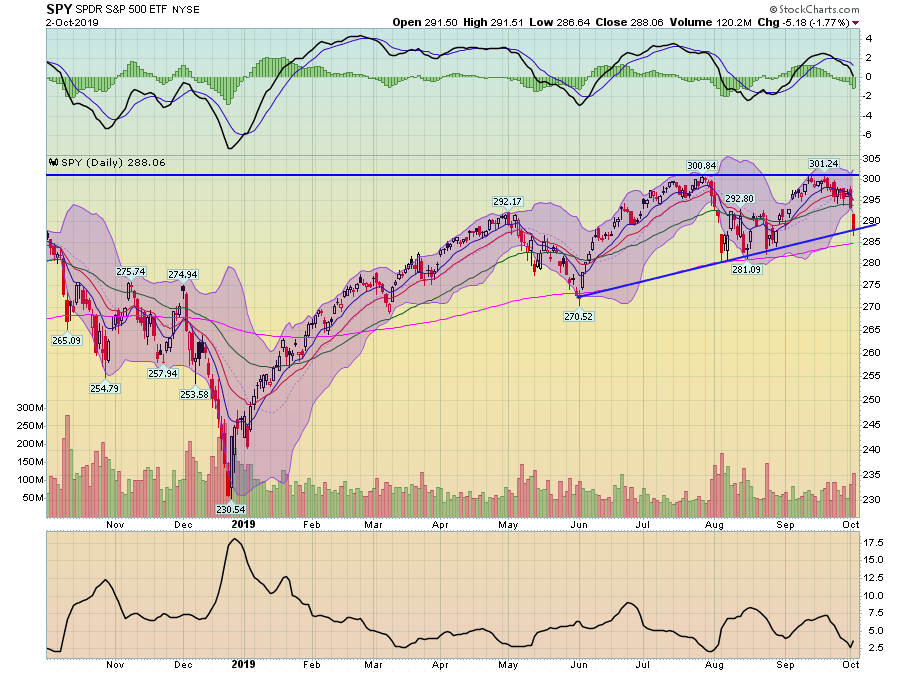
The SPY sold off and is now right at technical support.
Yesterday's news was concerning; the PMI data shows that global manufacturing is clearly weaker and the ADP data indicates that hiring is slowing (although it's still positive). Add to that the global trade slowdown and you have a recipe for slower economic growth and, by extension, lower equity prices.
