My friend, Doug Kass, recently penned an interesting note in his daily diary entitled “It Bears Repeating.” To wit:
“Several acquaintances I have that have consistently had bearish market outlooks acquiesced after Friday’s market ramp and have taken off their short hedges.”
Yes, that would be me.
But his important point is next.
“If, as I suspect, the early February dive was a tremor before the quake — I want to move back into a short position (consistent with my intermediate-term bearishness).
But, frankly, the timing of this move has never been more difficult.
Buyers live higher and sellers live lower in this world in which we are now often trying to interpret market, sector and individual price patterns that are ‘artificial.’
When bears grow bullish, in part, on possibly faulty data — we should all take a pause and reflect upon the possible downside and begin to cull out long positions which no longer have an attractive reward vis a vis risk.”
More Difficult Than Ever
Doug is absolutely correct. In my 30-year career of managing money in one form or another, I have never witnessed a time more difficult to navigate than what we have witnessed over the last several years.
Central Bank interventions, the explosion of leverage due to low interest rates and the “rise of the machines,” has made managing risk in portfolios exceedingly difficult.
As shown in the chart below, there were several occasions over the last decade that should have devolved into steeper declines.
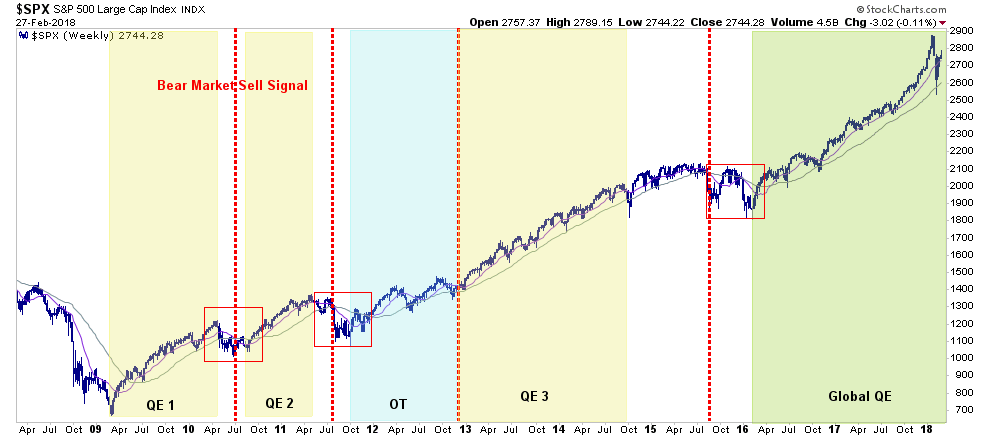
However, in each case, as historically important “sell signals” were triggered, Central Banks globally stepped in to stop the decline. Between those central bank interventions, and the force of mechanized trading, it has trained the investing public to ignore the “bearish” crowd and pile into excessively risky investing strategies which will eventually end tragically.
Just by saying that, I am a “bear.”
What investors would rather hear is:
“Fughetaboutit, just buy stuff and hold on as this market can only go up from here.”
After all, in hindsight it would have been the right thing to do.
It just won’t always be the case. (See, there I go again, being all bearish.)
Neither Bullish Or Bearish
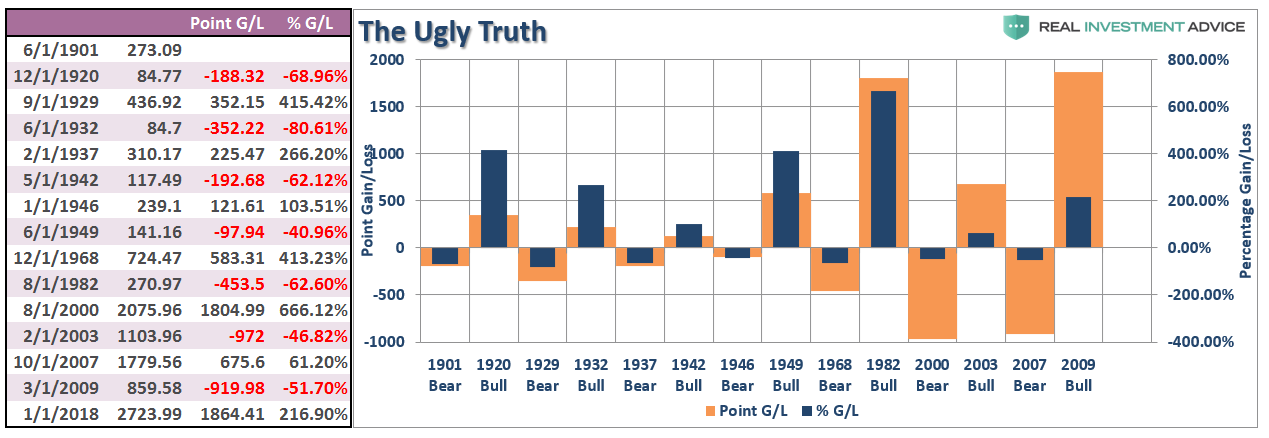
As I have often stated, I am not bullish or bearish. My job as a portfolio manager is simple; invest money in a manner that creates returns on a short-term basis, but reduces the possibility of catastrophic losses over the long-term. The table shows the actual point gain and point loss for each period. As you will note, there are periods when the entire previous point gains have been either entirely, or almost entirely, destroyed.
In our portfolio management practice, we focus on weekly and monthly data to smooth out daily volatility. Since we are longer-term investors, our focus remains on being invested during rising (bullish) trends and more heavily weighted to fixed income and cash during declining (bearish) trends. Therefore, the only data that really matters to us is where the market closes at the end of each week.
As I stated recently:
“While the immediate consensus is the ‘bear market of 2018’ is now over, there are several important points about the chart below that should be considered.
- Despite the correction, the market did hold support at the 200-dma
- The bullish trend line, which goes back to the beginning of 2016, has also not been violated.
- However, the upper red ‘trendline’ may provide some overhead resistance temporarily and is worth watching closely.
- While the market did get oversold on a short-term basis, which suggested a bounce was likely, the longer-term overbought condition, and subsequent ‘sell signal’ remain intact.
The bottom line is that while there was much ‘angst’ in the markets last week, the market has not violated any important trend lines that would suggest the current sell-off is anything more than just an ordinary ‘garden variety’ correction.“
Chart updated through Wednesday’s close.
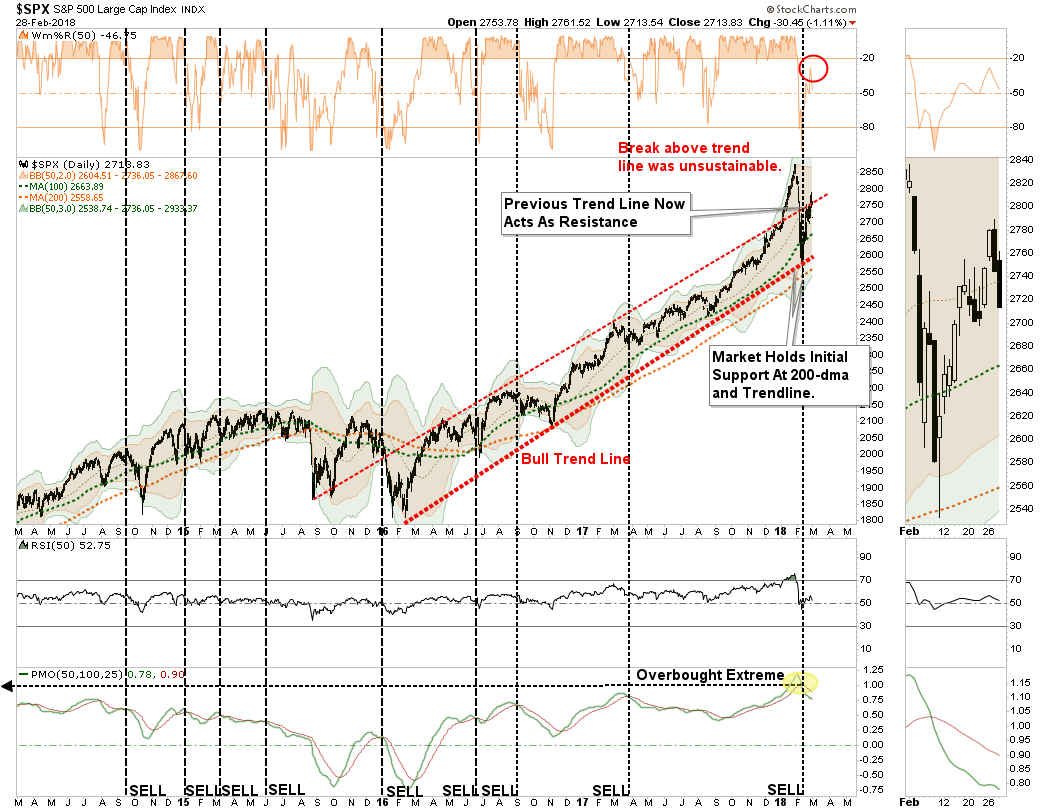
As Doug noted, with the close back above the 50-dma, we DID indeed remove our hedges.
However, the market tumbled at the end of the trading day on Wednesday falling back below the moving average. This decline not only reinforced the upper trend line, as noted in Point 3 above, but also strengthens resistance at the 50-dma. But, it is where we close at the end of the day on Friday will determine whether, or not, we reinstate our hedges.
As I discussed in our most recent newsletter, as noted by Doug above, I laid out both the “bullish” and the “bearish” case.
“Here is what we are looking for:
Bullish
- If the market can break above current resistance, equity exposure can be added to portfolios for a push back towards previous highs.
- That pushback to previous highs will also be a breakout of the already accelerated bullish trend. While bullish in the short-term, such a rally will likely be limited in its rise as overbought conditions are already returning very quickly.
- The target for a rally from current levels puts the market in the 3200 range.
Bearish
- On the bearish side, a failure at current resistance levels would likely lead to a retracement to the 200-dma. Such a correction would also trigger the MACD sell-signal which is already at historically high levels. That “sell signal” will put additional downward pressure on the market.
- As long as the market holds at the rising bullish trend and 200-dma, the bullish backdrop remains intact keeping portfolios weighted towards equity exposure.
- However, if the market breaks below those ‘critical support’ levels, as noted above, the risk of a deeper correction rises. Such a break will lead to increased hedging and a reduction of equity risk in our portfolio models.
- A break of that critical support will likely lead to a retest of the longer-term bullish trend around 2250 which would be a 22% decline from recent highs and an “official bear market.”
- A break below 2250 will likely coincide with the onset of the next recession and is an entirely different portfolio management strategy.
While the ‘Great Bear Market Of 2018’ may indeed be behind us, for now, it did NOT resolve the longer-term overbought, overvalued and overly bullish conditions for investors.
The recent rally has quickly relieved the pervasive ‘panic’ of the media which existed just two weeks ago, and the ‘perma-bulls’ have emerged back out of their bunkers. However, the risks of a larger correction are still present. We still highly recommend investors rethink levels of risk exposure in portfolios and take some actions.”
For us, the longer-term trend remains bullish so we want to give the market the benefit of the doubt. This is why we removed our short-market hedges temporarily. However, note in the chart above the MACD “sell-signal” has been triggered which certainly raises our “caution” about the market currently.
So, let me be very clear.
If the market fails to hold the 50-dma by the end of this week, we will add our hedges back to portfolios, rebalance risk in portfolios and raise cash as needed.
We absolutely agree with Doug’s points about the risks that currently prevail in the market.
Despite the recent correction, which was barely noticeable on a longer-term chart, none of the underlying long-term fundamental or technical problems were corrected. As noted previously:
“Major mean reverting events are generally tied to the combination of more major extremes in long-term measures of price deviations, economic growth, and valuations. Using quarterly data we can calculate several long-term measures for the S&P 500:
- The 12-period (3-year) Relative Strength Index (RSI),
- Bollinger Bands® (2 and 3 standard deviations of the 3-year average),
- CAPE Ratio, and;
- The percentage deviation above and below the 3-year moving average.
The vertical RED lines denote points where all measures have aligned”
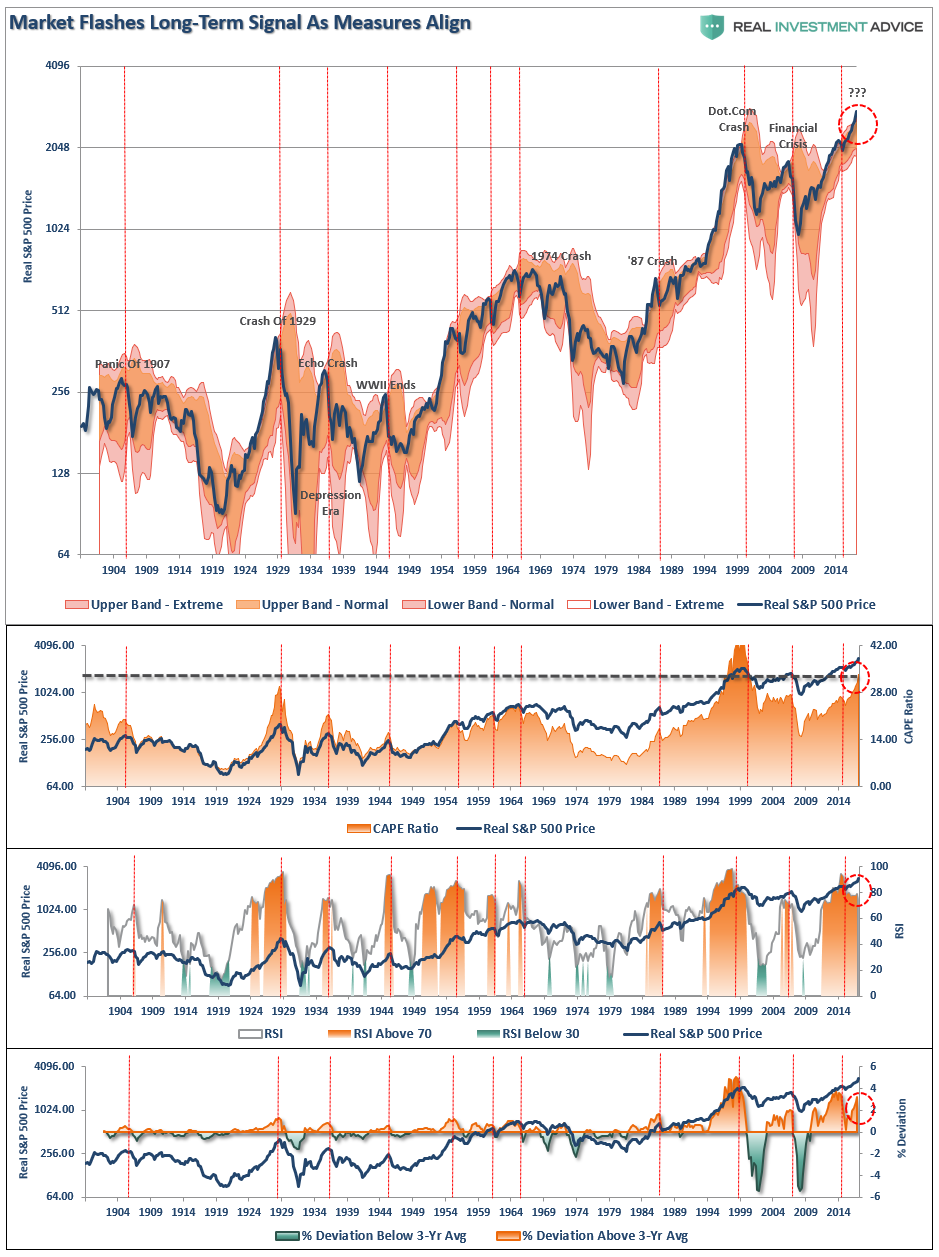
“On virtually every measure price and valuation, the markets are grossly extended. However, it is when these measures coincide with the onset of an economic recession that ‘mean reverting’ events tend to occur.”
Over the next several weeks, or even months, the markets can certainly extend the current deviations from long-term means even further. This is particularly the case given the continued “jawboning” given to the markets by the Federal Reserve “promising” action in the event of a problem.
But do not be misled.
This will end and the second-half of the full-market cycle will complete.
Of that, there is absolute certainty.
Conclusion
Our job, for our clients, is to navigate the waters within which we currently sail, not the waters we think we will sail in later.
On a longer-term basis, we remain very pessimistic about the return aspect from the markets. As my partner Michael Lebowitz noted yesterday:
“With the current CAPE at 33.41 as circled, investors should expect an annualized excess return for ten years of -2.04%. Based on historical data which includes 32 full business cycles dating back to 1871, the best excess return experienced for all instances of CAPE over 30 is 0.39%. Over this 147 year period, there have been 57 monthly instances in which the CAPE was above 30. Only four of these instances provided an excess return over Treasuries and the average was a paltry twenty basis points or 0.20%.”
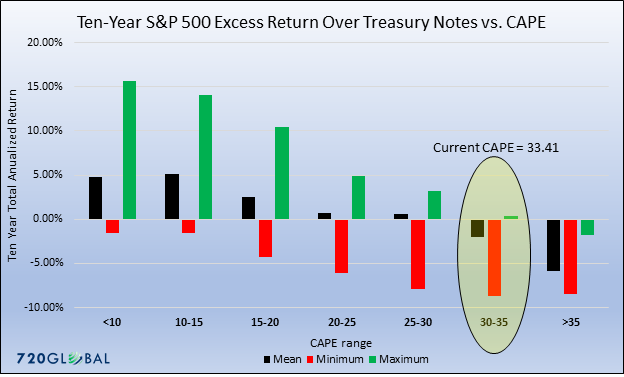
“Call us cynical, but the prospect of equity market excess returns for the next ten years measuring in the fractions of a percent is not nearly enough compensation for the distinct possibility of underperforming a risk-free asset for ten years.”
We consistently work to recognize, and be responsive to, changes in underlying market dynamics. When they change, we adopt our strategy accordingly but always remain keenly aware of the risks that are inherent in portfolio allocation models. The reality is that we can’t control outcomes. The most we can do is influence the probability of certain outcomes which is why the day to day management of risks and investing based on probabilities, rather than possibilities, is important not only to capital preservation but to investment success over time.
Not I, or anyone, knows with certainty what the future holds which is why we focus solely on the management of portfolio risk and act accordingly when conditions change.
We follow a very simple set of rules which are the core of our portfolio management philosophy which focuses on capital preservation and long-term “risk-adjusted” returns.
For now, Doug is right….my bearish side is temporarily taking a nap.
