The Bear Market Of 2018
Let’s start with where we left off last weekend:
“Currently, we do not know whether the current corrective action is JUST a normal, healthy correction, or the beginning of something bigger.
BUT – this is the expected correction we have been discussing over the last several weeks. It is also something we had planned for by reducing overweight positions and adding a short-hedge to portfolios.
With the markets on a short-term sell signal (noted by black vertical dashed lines in the chart above,) the current correctional process is underway. But, with the market now oversold on a VERY short-term basis a counter-trend rally over the next week, or two, should be expected.”
Well, we did indeed get a very nice S&P 500 rally last week with the market breaking above the 50-dma on Thursday.
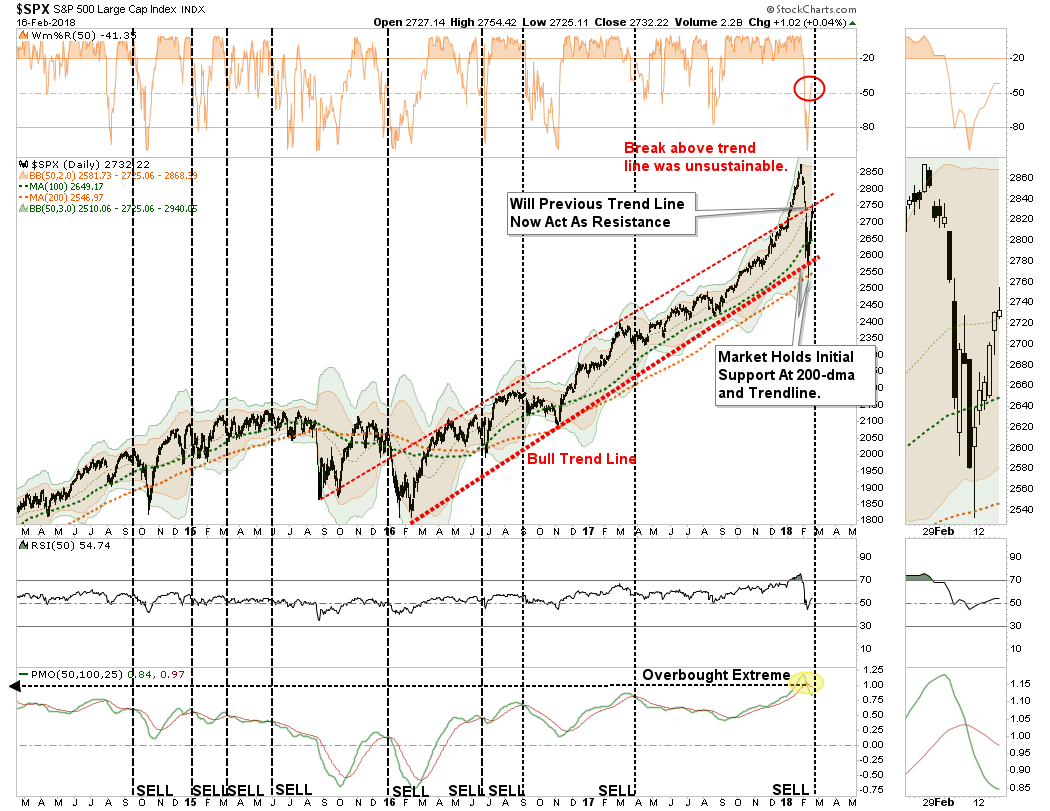
While the immediate consensus is the “bear market of 2018” is now over, there are several important points about the chart above that should be considered.
- Despite the correction, the market did hold support at the 200-dma
- The bullish trend line, which goes back to the beginning of 2016, has also not been violated.
- However, the upper red “trendline” may provide some overhead resistance temporarily and is worth watching closely.
- While the market did get oversold on a short-term basis, which suggested a bounce was likely, the longer-term overbought condition, and subsequent “sell signal” remain intact.
The bottom line is that while there was much “angst” in the markets last week, the market has not violated any important trend lines that would suggest the current sell-off is anything more than just an ordinary “garden variety” correction.
But, I wrote:
“The larger concern currently, is the ‘sell signal’ which has been triggered at abnormally high levels and remains in extremely overbought territory. Such suggests there remains ‘fuel’ for either a ‘deeper correction’ or a ‘consolidation’ of the markets in the weeks ahead to ‘work off’ that ‘overbought’ condition. Historically, markets don’t resolve such conditions by trading ‘sideways.’”
While we are watching that closely, it certainly doesn’t mean the market can’t rally higher from here. In fact, with the markets clearing the 50-dma on Friday, the upper-trend line and old highs are currently the only real resistance. With markets not yet back to “overbought” conditions, it is certainly possible for the market to rally further next week.
The greenish triangle shows the path of the accelerated bullish trend that began last August which currently remains the most likely path for now.
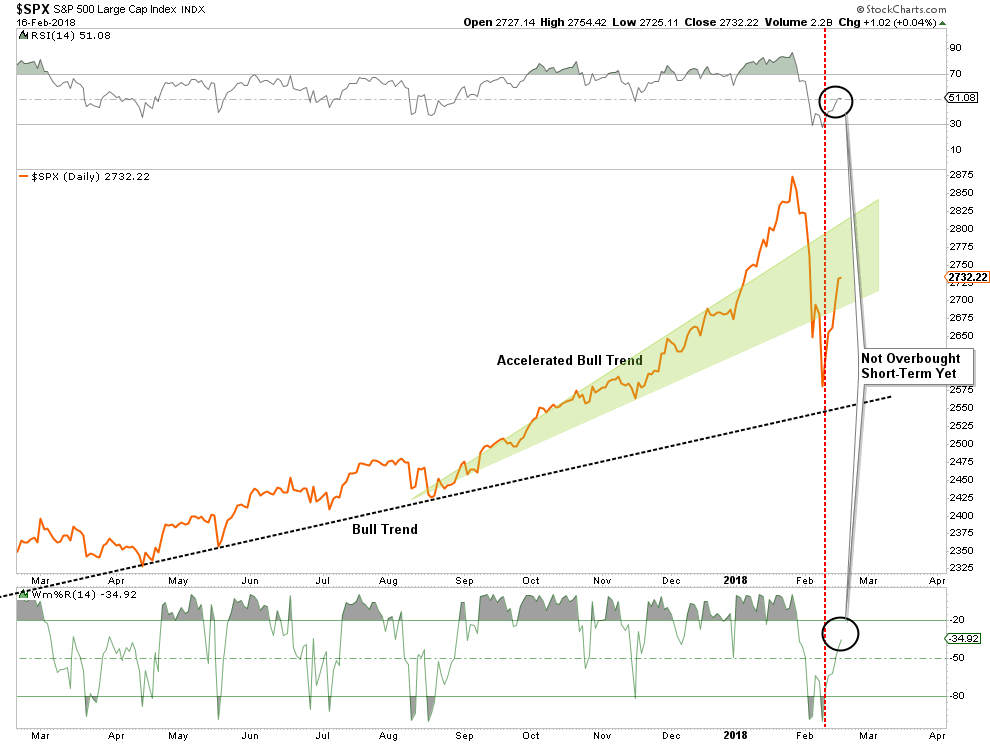
While the “Great Bear Market Of 2018” may indeed be behind us, it did NOT resolve the longer-term overbought, overvalued and overbullish conditions for investors.
The Real Bear Is Still Coming
The good news, for those who remain ever bullishly inclined, is on a long-term, monthly basis, the bull market remains intact for now.
Unfortunately, despite the rather harrowing correction, little was done to relieve any of the underlying pressures.
- Valuations still remain elevated
- Bearishness and volatility, despite the recent spike, remain at historically low levels, and;
- Investors simply could not jump “back” into the markets fast enough.
These are not signs of a real, lasting bottom, which long-term investors should aggressively buy into.
Given the current extension of the market, and the deviation between the current price and long-term average, a real reversion to the mean is still coming. If you thought the 10% decline over the last two weeks was painful, you should be reconsidering the risk you are currently carrying in your portfolio.
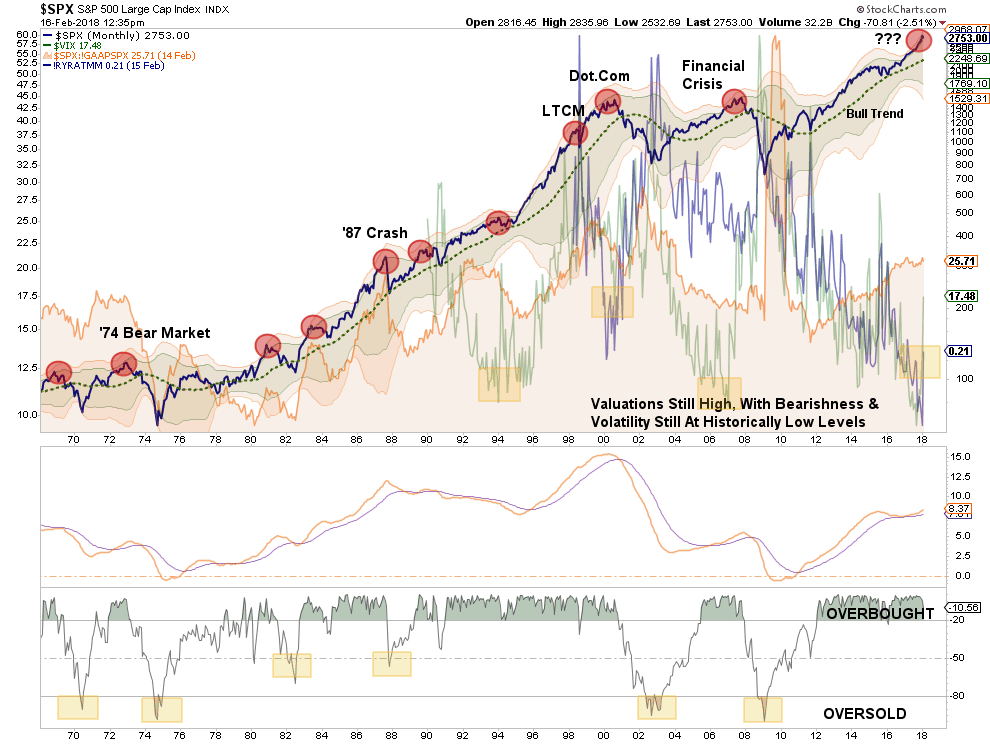
More importantly, as denoted by the red circles, the market is currently trading 3-standard deviations above the long-term average. This has only happened a few times in history and has generally preceded a rather deep correction in the not too distant future.
When will that be?
I don’t know. Nor, does anyone else.
But, we have seen this type of action before.
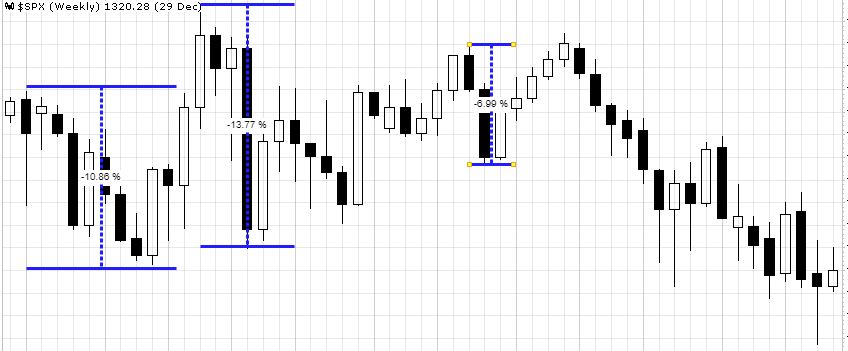
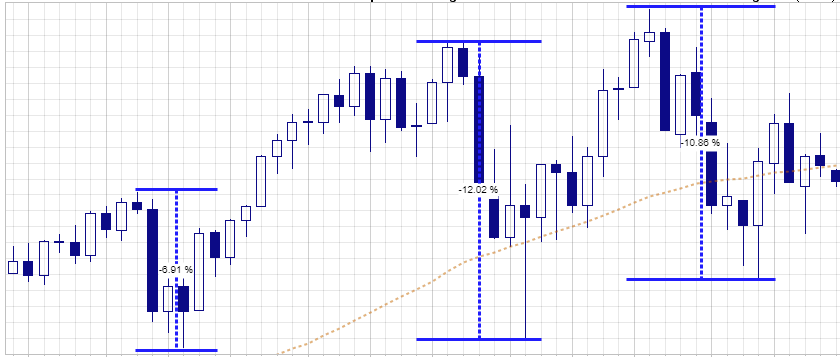
If you don’t recognize those charts, they are 2000 and 2007 respectively.
Each initial correction was followed by a rally to new highs which convinced investors the “bull market” would never end. But you should already know the rest of the story.
The only thing more dangerous to investors long-term outcomes than being overly optimistic, is ignoring history.
Remaining Bullish For Now
As we stated last week, the “odds” favor the “bulls” currently because:
- Bull markets last longer than bear markets
- Bull markets are hard to break
- Bull markets can defy logic longer than most anticipate
But bulls, like bears, are only right half the time.
Unfortunately, when the “bulls” are wrong – they are “really wrong,” and the long-term damage to capital is irreparable.
This is why we maintain a focus on the “trend” of the market for maintaining portfolio allocations. When markets begin to break down, or change trend, and the risk of loss outweighs the potential for reward, we become aggressively defensive.
Currently, such is NOT the case, as the bullish trend remains intact.
The chart below shows the weekly view of the S&P 500 index going back to 2014.
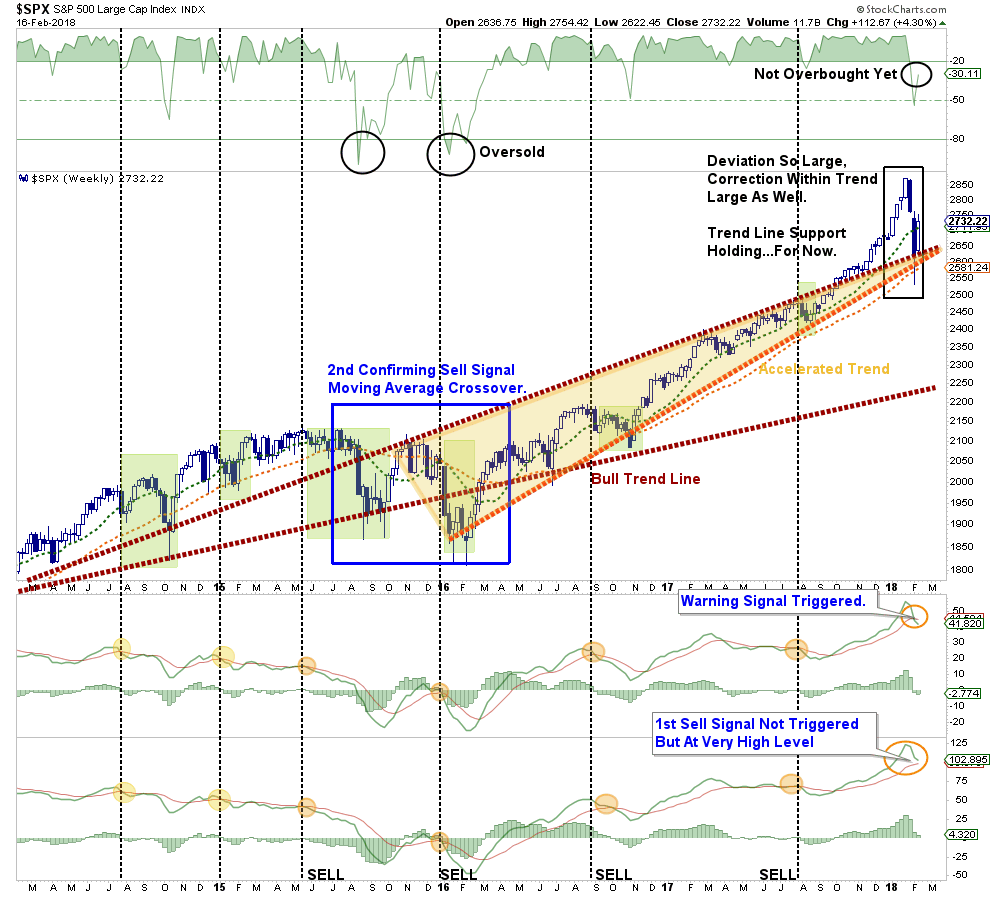
Since this is a weekly indicator, a strong rally, or decline, mid-week can REVERSE a signal. While the “1st sell signal” is still getting closer, the rally this past week kept it from triggering, for now.
As I detailed last week:
- The first of the two is simply an “ALERT” signal which suggests investors should “pay attention” to their risk related allocations and rebalance those risks accordingly.
- When both lower signals are triggered, a confirming signal, such has generally been a good indication to more proactively reduce allocations, raise SOME cash, and further reduce risk related exposure.
Currently, the market has not violated the accelerated bullish trend nor the bullish trend support levels from the pre-2016 correction advance. With nothing more than just an “alert” signal at this point, there is little to do portfolio wise, except rebalance and reposition risk as discussed below.
Importantly, we are not trying to “guess” at what the market “will do,” we are simply “reacting” to what it “does do. “
The trend is still bullish and we remain long….for now.
That will eventually change, and, as indicated by the green boxes, if it does we will act accordingly reducing risk, raising cash and hedging further as we have done previously during those specific periods.
While we remain on “alert” status currently, the recent correction was nothing more than a much-needed correction within a very extended bullish trend.
Rebalancing Suggestions
It may be time for investors to rethink levels of risk exposure in their portfolios currently.
As I stated at the end of December, we reduced exposure in portfolios by raising cash, adding hedges and rebalancing portfolios back to target weightings.
As noted above, given the sharp sell-off, and subsequently sharp rally over the last couple of weeks, it is prudent to rebalance portfolio risks. Here are some guidelines to think about.
Step 1) Clean Up Your Portfolio
- Tighten up stop-loss levels to current support levels for each position.
- Take profits in positions that have been big winners
- Sell laggards and losers
- Raise cash and rebalance portfolios to target weightings.
Step 2) Compare Your Portfolio Allocation To Your Model Allocation.
- Determine areas requiring new or increased exposure.
- Determine how many shares need to be purchased to fill allocation requirements.
- Determine cash requirements to make purchases.
- Re-examine portfolio to rebalance and raise sufficient cash for requirements.
- Determine entry price levels for each new position.
- Determine “stop loss” levels for each position.
- Determine “sell/profit taking” levels for each position.
(Note: the primary rule of investing that should NEVER be broken is: “Never invest money without knowing where you are going to sell if you are wrong, and if you are right.”)
Step 3) Have positions ready to execute accordingly given the proper market set up. In this case, we are looking for a retest of the 50-dma to confirm the recent recovery.
Stay alert…I have a sneaky suspicion we are not out of the woods just yet.
See you next week.
Market and Sector Analysis
Data Analysis Of The Market & Sectors For Traders
S&P 500 Tear Sheet
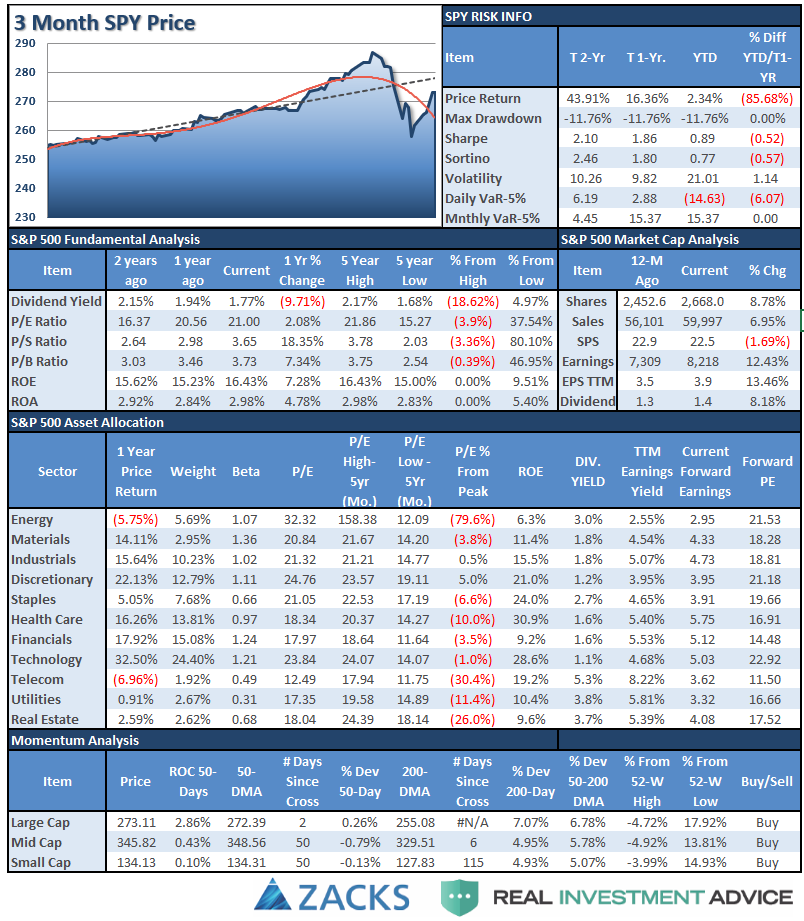
Performance Analysis
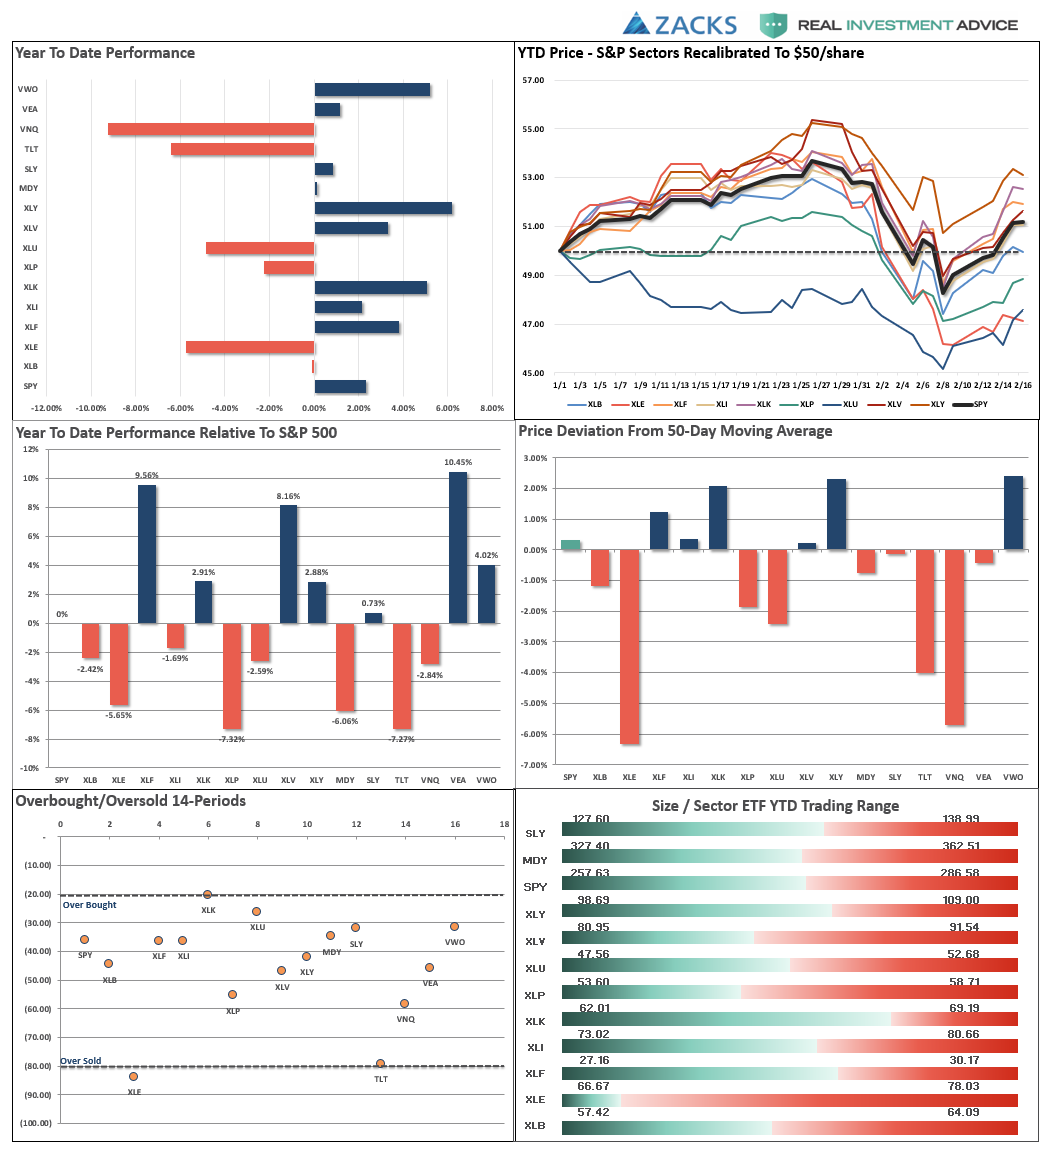
ETF Model Relative Performance Analysis
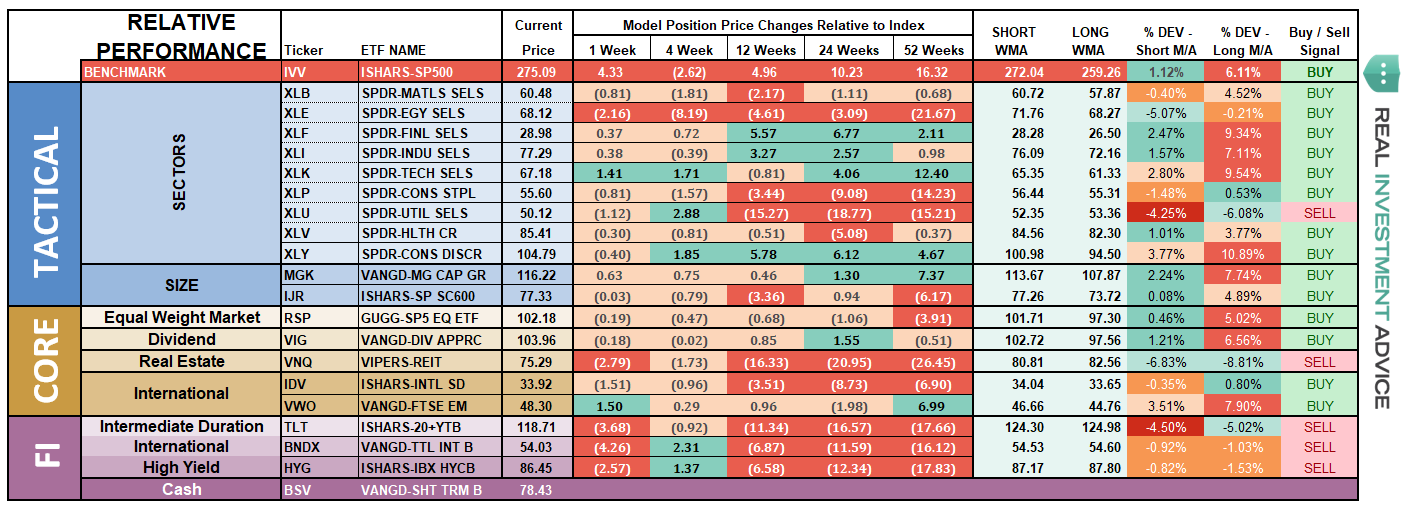
Sector and Market Analysis:
As expected, the markets did indeed bounce last week. But the bounce was not uniform across all sectors and markets, so let’s take a closer look.
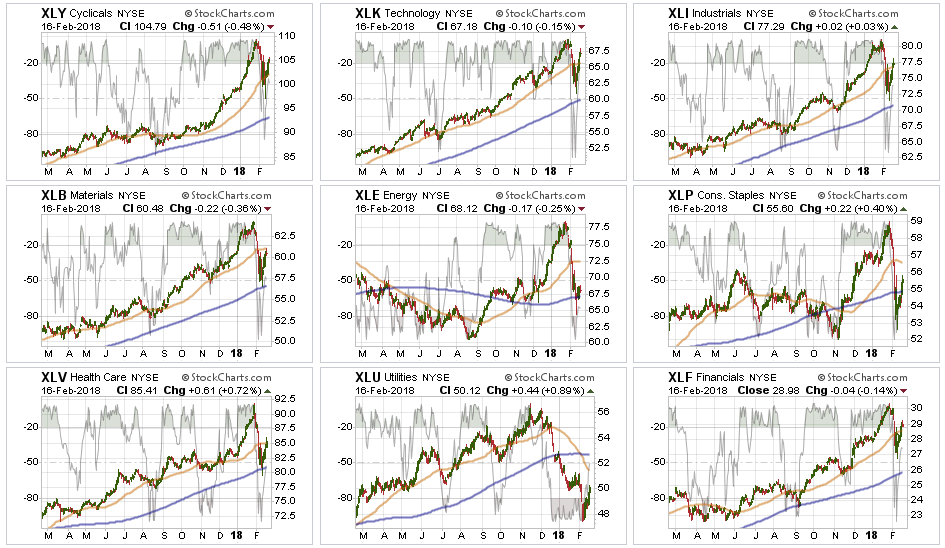
Discretionary, Technology, Industrials, Health Care, and Financials each regained their respective 50-dma which sets these sectors up for a retest of their old highs. However, after a very sharp reversal, these sectors are quickly becoming extended which suggests this is a good time to rebalance portfolio weights.
Materials, Energy, Staples, and Utilities performed substantially worse raising concerns over their positioning. We will be watching for failed rallies next week to reduce holdings in this sectors and underweight them in portfolios for the time being.
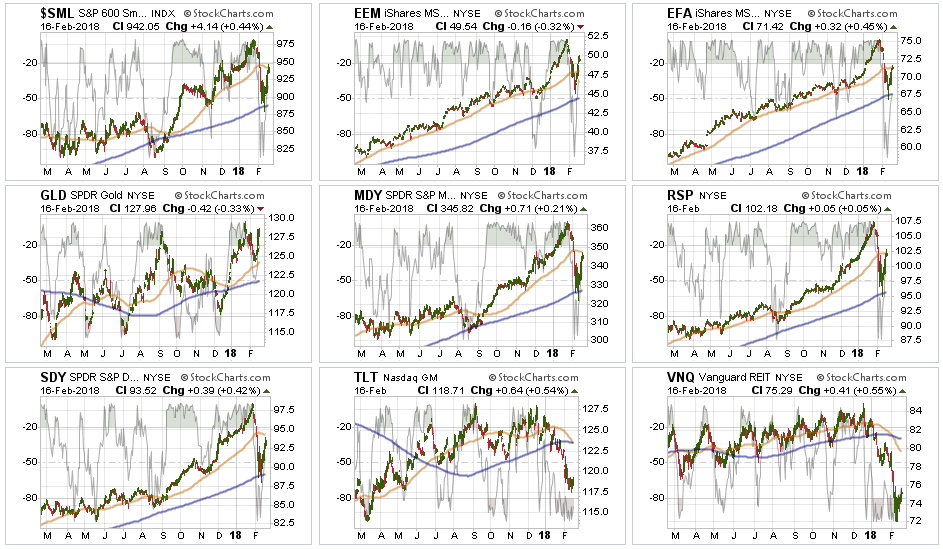
With the exception of Emerging Markets and Gold, the 50-dma provided formidable resistance to the broader markets. We will need to see some further improvement next week, or we will likely see another bout of selling in the markets short-term.
Bonds and REITs appear to be attempting a recovery, along with the markets, we will look to underweight holdings on any failed rally to resistance.
As a side note, interest rates remain GROSSLY oversold which sets interest rate sensitive shares up for a very nice counter-trend rally. If we see a weakening in the economic or inflationary data over the next several weeks, such could lead to a fairly rapid reversal.
Sector Recommendations:
The table below shows thoughts on specific actions related to the current market environment.
(These are not recommendations or solicitations to take any action. This is for informational purposes only related to market extremes and contrarian positioning within portfolios. Use at your own risk and peril.)
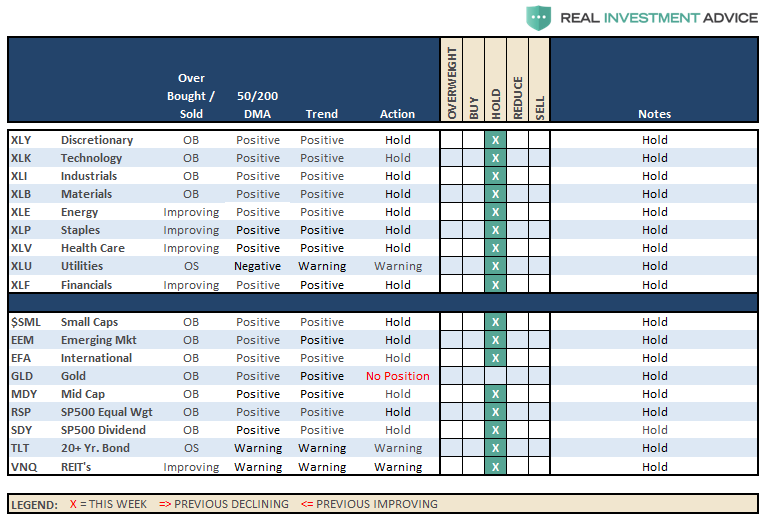
Currently, HOLD, all positions until we get a better understanding of the current correction as noted above. I will update strategy and actions on Tuesday.
Portfolio Update:
We previously, added to our short hedge when the market failed at the 50-dma.
We then sold that added position when the market found support at the 200-dma.
We will now look to do the following next week:
- Rebalance positions to target weights, based on allocation models, if the market holds above the 50-dma.
- Remove remaining hedges.
As we stated two weeks, this market has a lot of work to do over the coming week. Furthermore, there is a risk the recent rally was only the first part of a corrective process so we remain vigilant. Currently, everything remains within our longer-term tolerance bands for risk controls. While corrections certainly do not “feel” good, it is important we don’t let short-term pickups in volatility derail longer-term investment strategies.
The market rally last week quickly relieved a lot of the pressure on positions which gives us time to logically think about our next set of actions. As stated above, we are highly concerned about remaining market risk and remain focused on capital controls.
