
Technically Speaking For May 1
Summary
- EU economic news is mixed.
- Despite a recent sell-off, oil is in an uptrend.
- It's possible the QQQ is topping.
News from the EU is mixed. Sentiment continues to decline. Here's a chart of the data:
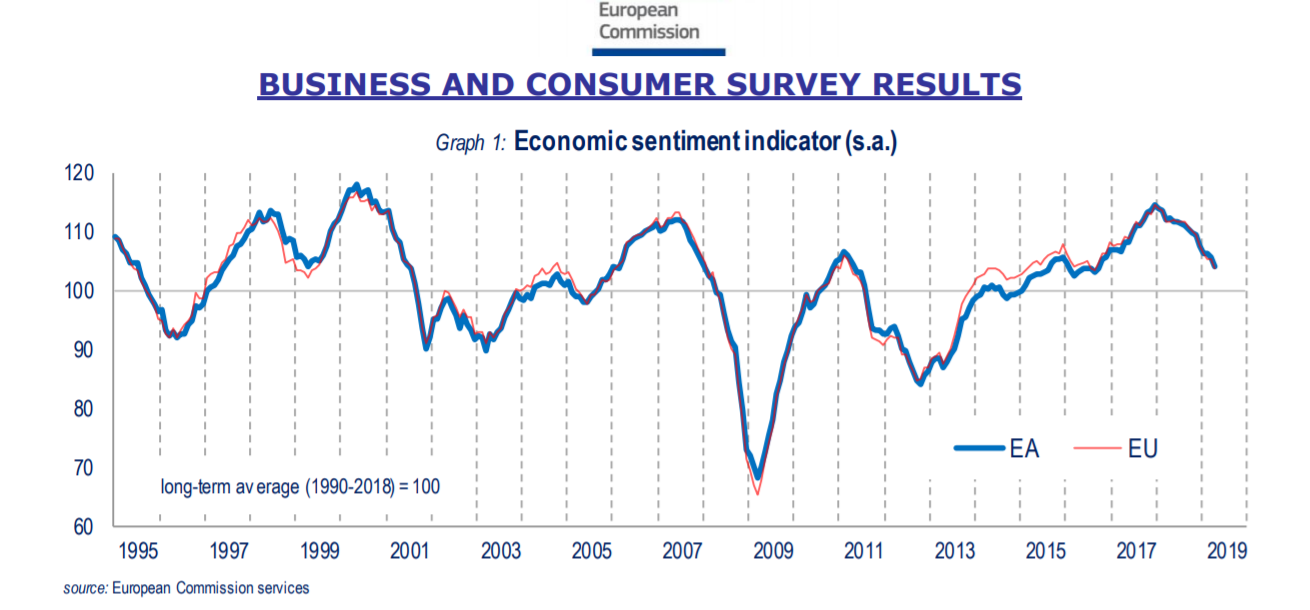
The drop started at the tail-end of 2017 and has been heading consistently lower since. Here's a chart of four major sectors:

All are weaker. Industrial (top left) and consumer (bottom left) are especially low. Inflation is still low. All numbers are Y/Y: France +1.2%; Spain +1.5%; Germany +2%; and Italy up 1.1%. On the plus side, GDP increased .5% in the latest reading, although the Y/Y percentage change was still 1.2%. As sentiment leads activity, the drop is a major concern. Hopefully, the improved GDP growth figures will help.
Oil is still in an uptrend:

Oil started to rally at the beginning of February and has been moving higher since. At the beginning of April, it moved through resistance in the mid-60s but has since fallen back to the 10-20 day EMA for support. Recently, the Trump administration announced they would no longer grant exemptions to Iranian oil importers, a move that will further constrict global supply. According to the latest NY Fed oil price report, rising prices are a function of rising demand and lower supply:
- Strengthening demand expectations and lower anticipated supply resulted in an increase in oil prices this week. In 2019: Q1, oil prices rose due to increasing demand.
- In 2018, strengthening global demand expectations drove oil prices higher. This trend reversed in 2018: Q4, weaker expected demand and higher anticipated supply lowered prices.
The Census released the latest construction spending data (emphasis added):
Construction spending during March 2019 was estimated at a seasonally adjusted annual rate of $1,282.2 billion, 0.9 percent (±1.0 percent)* below the revised February estimate of $1,293.3 billion. The March figure is 0.8 percent (±1.5 percent)* below the March 2018 estimate of $1,293.1 billion. During the first three months of this year, construction spending amounted to $277.7 billion, 0.2 percent (±1.3 percent)* below the $278.3 billion for the same period in 2018.
Here are two charts of the data:
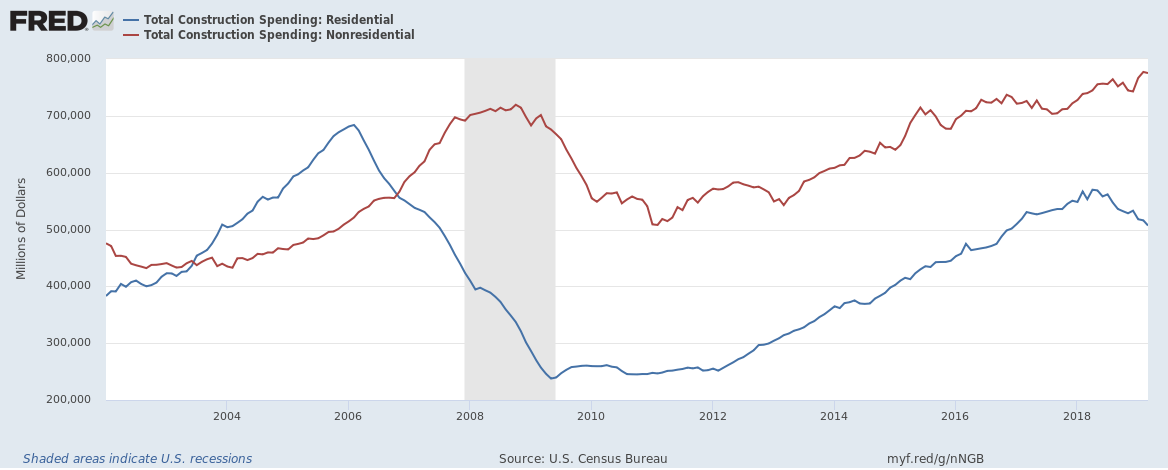
Residential (in blue) has been declining for the last year. On the other hand, commercial (in red) continues to increase.
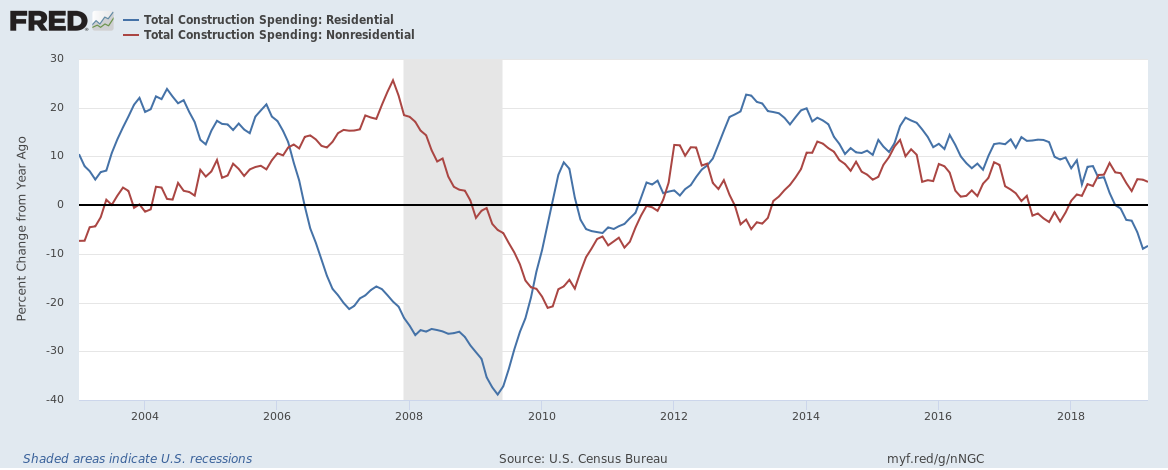
On a Y/Y basis, residential is now contracting and has been for the last few months. Commercial, on the other hand, is growing at a moderate rate.
Turning to today's performance table, we see another down day:

The Treasuries outperformed; they were up a bit. At the bottom are transports, small and mid caps. Notice the QQQ - as usual, it's the best performer on the day, although this time it's in the middle of the performance pack.
The QQQs have regularly outperformed the broader market over the last few months. However, it's possible that the QQQ could be topping.
Let's start this analysis with a 10-year daily chart of the QQQ:

Notice the MACD in the top panel. It's currently pegged at very high levels. In fact, it's near its highest level in the last 10 years. It's always possible that it could stay at high levels for an extended period of time. But, the more than likely path is that it falls, and with it, prices.

On the shorter daily chart, prices are just above highs in the mid-180s. The MACD has been pegged at high levels for the last three months.
Next, let's go close and look at the last five trading day:

Prices have been hitting resistance in the lower 190s. They have tried to get beyond that level three times, only to fall back. 
The high is more pronounced and apparent on the two-week chart.

On the 30-day chart, we see prices hitting resistance. Also, notice declining momentum along with a series of lower lows. This is a bearish development.
If the QQQ goes, the rest of the market will follow. Stay alert.
Disclosure: I/we have no positions in any stocks mentioned, and no plans to initiate any positions within the next 72 hours. I wrote this article myself, and it expresses my own opinions. I am not receiving compensation for it (other than from Seeking Alpha). I have no business relationship with any company whose stock is mentioned in this article.