Summary
- It's looking more likely that we'll see an earnings recession soon.
- Global equity markets are mostly higher over the last month.
- The markets had a solid move higher today.
Is an earnings recession on the horizon? From the NY Times (emphasis added):
But warning signs keep flashing about the shaky fundamentals of the economy and therefore the stock market. The latest alarm bell is that Wall Street analysts are slicing their forecasts for how much big companies will earn in the months ahead.
Halfway through the first quarter of the year, analysts now expect profits of companies in the S&P 500 to decline by 1.7 percent from the same period last year, according to data from John Butters, senior earnings analyst at FactSet.
We've known since the passage of the TCJA (Tax Cuts and Jobs Act) in late 2017 that the current quarter's comparisons would be difficult. That's not the only reason for earnings weakness, however. There's been a general global slowdown, especially in China and the EU. High tariffs are squeezing margins. And high political uncertainty is lowering sentiment, which creates a drag on all economic activity. Yesterday, the FT reported that Morgan Stanley (NYSE:MS) is now telling clients that the earnings recession is here.
Most of the major global equity markets have gained in the last month:
China has risen a healthy 5.78%; the SPY (NYSE:SPY) is a close second with a 5.25% gain. Asia ex-Japan is up nearly 5%. At the bottom end of the table are Latin American equities -- Brazil specifically and the broader region more generally. The question now becomes is this a "dead-cat" bounce or the start of a new move higher. I would tend to argue against the latter due to the weaker growth environment.
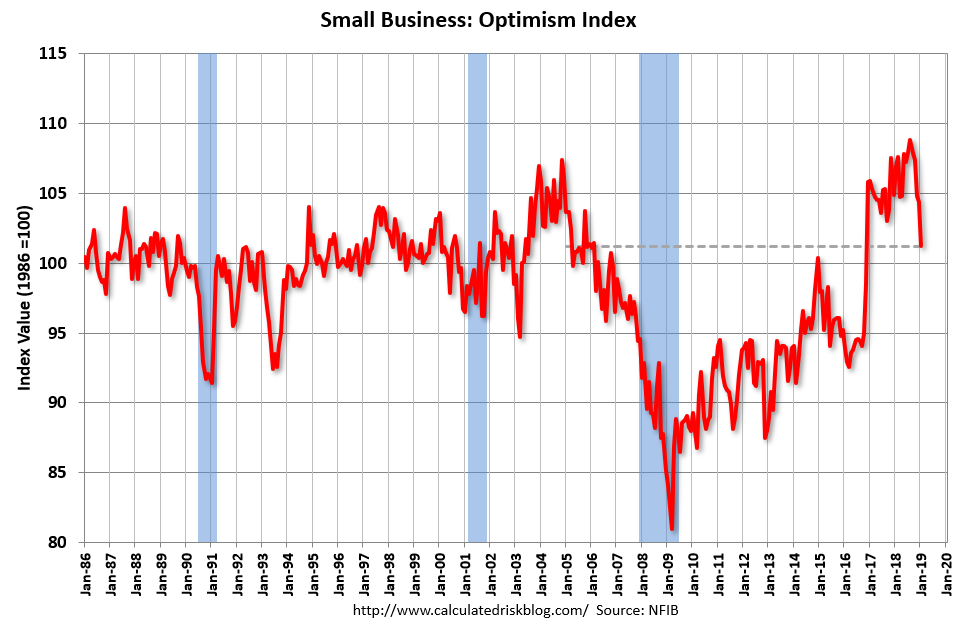
Business sentiment is lower:
Don't read too much into this data; the U.S. political environment over the last few months has been very turbulent. It has since settled down somewhat, which means a sharp rebound wouldn't be out of order. The next few months of data are very important.
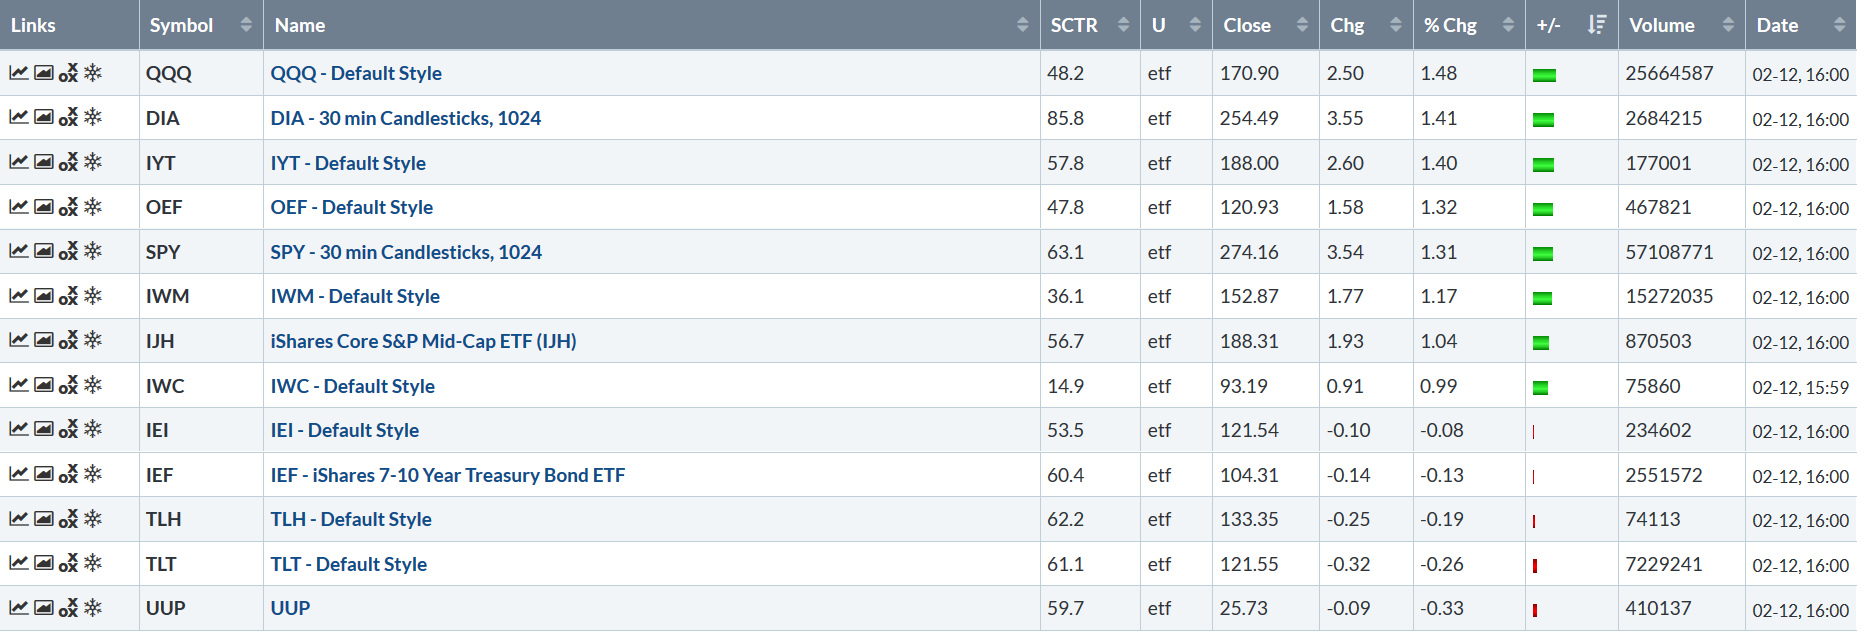
Let's take a look at today's performance table:
In contrast to yesterday when the small caps led the way higher, today it's the larger companies, with the QQQ (NASDAQ:QQQ) and DIA (NYSE:DIA) holding the top spot. Still, the riskier averages did well; the micro-cap was up .99 while the IWM (NYSE:IWM) increased 1.17%. The treasury market was off modestly.
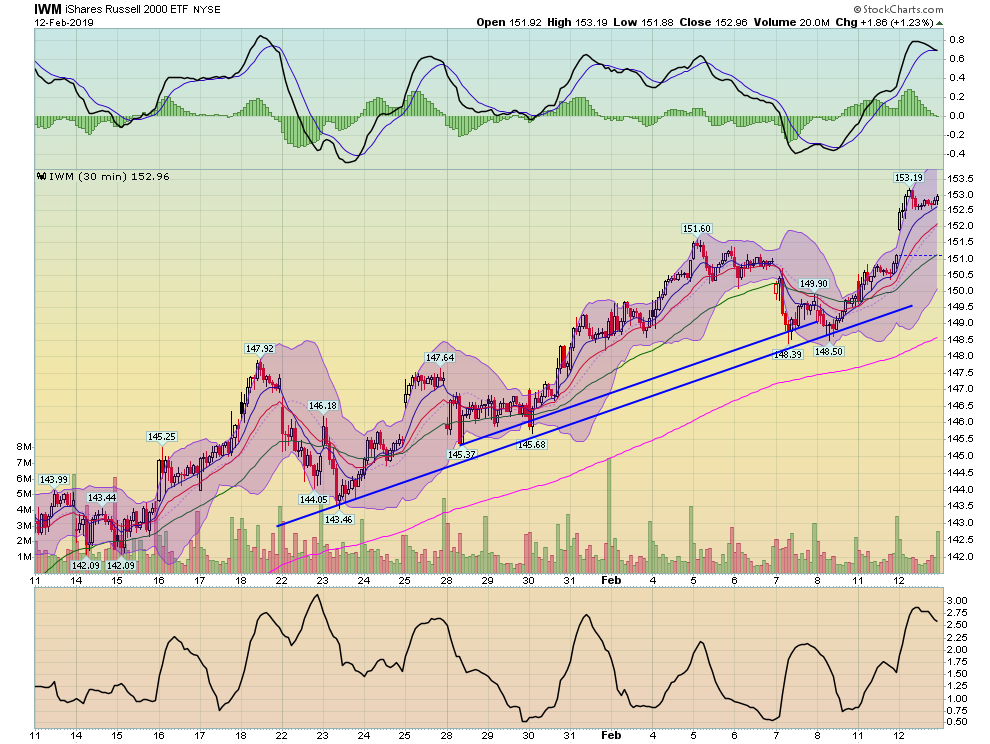
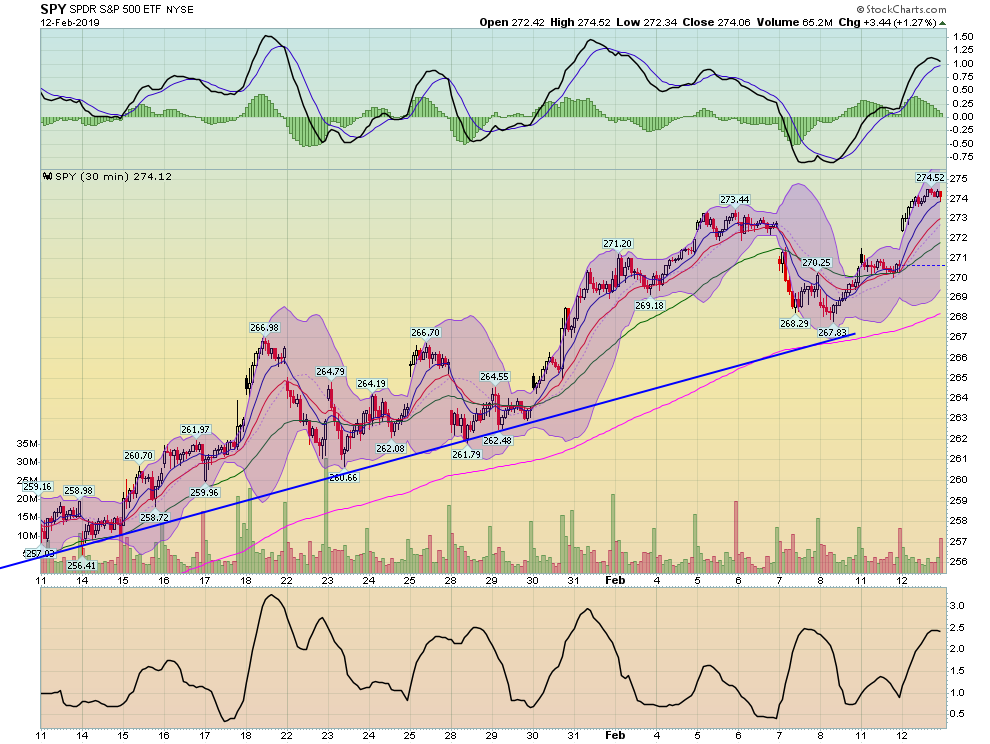
Let's move to the charts, first by noticing a clear difference between today's performance for the IWM and SPY: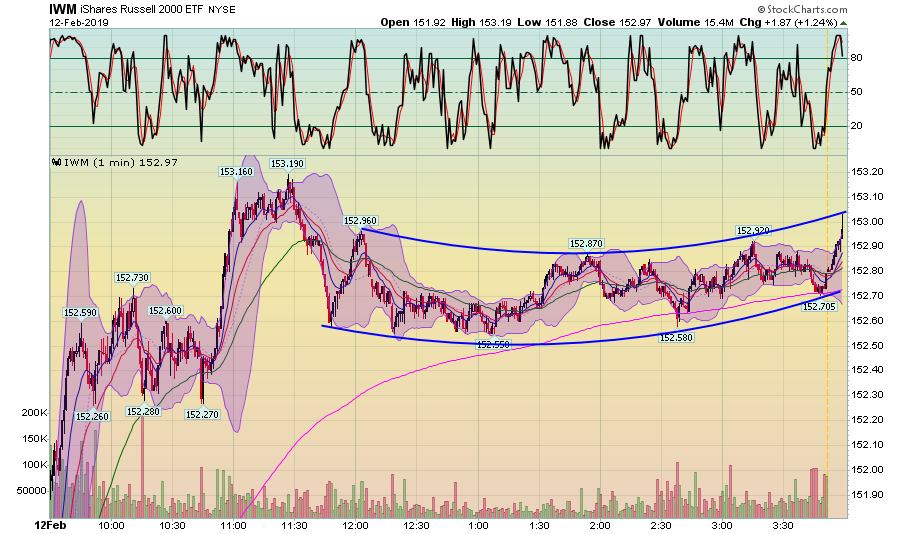
The IWM gapped higher at the open then made a second move higher in the late morning. The index sold off in the afternoon, falling to the 200-minute EMA. The prices then formed a curving channel, with prices spiking at the close.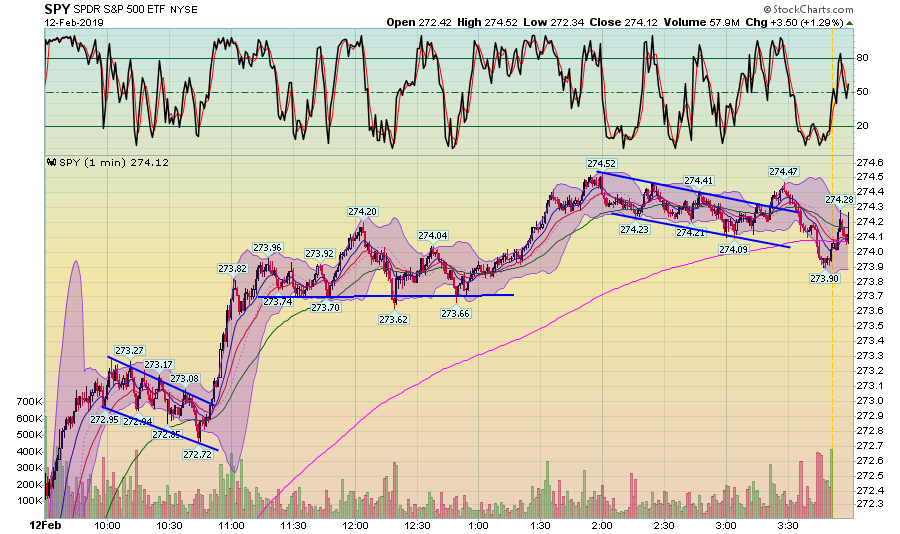
In contrast, the SPY moved higher for the entire session, rallying and then consolidating in three separate trading ranges.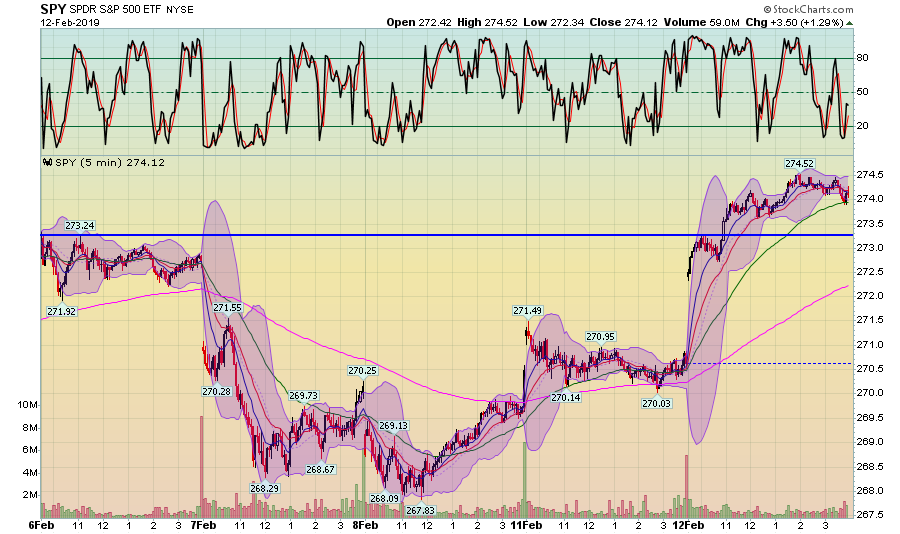
On the five day chart, the SPY has moved through resistance at the 273 level and is near a 5-day high as of today's close.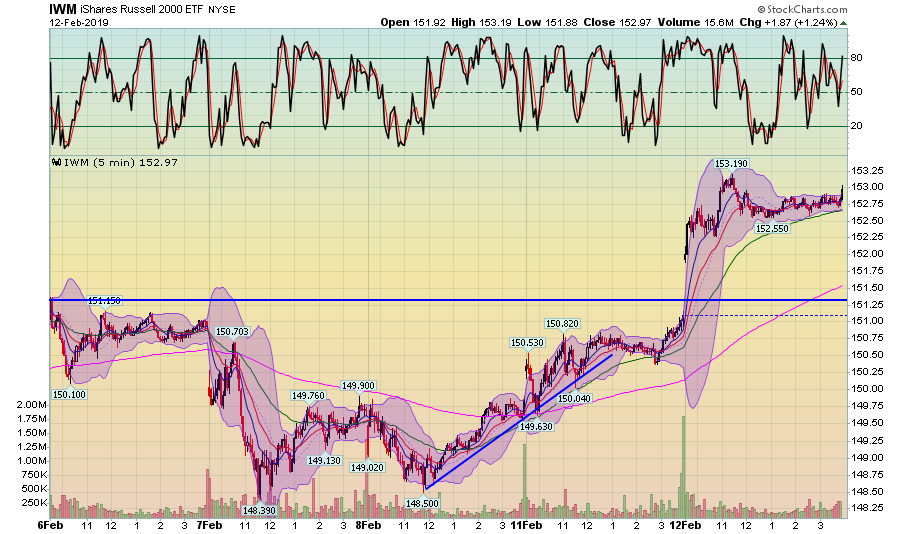
The IWM gapped higher at the open, making a big move through the 151 level.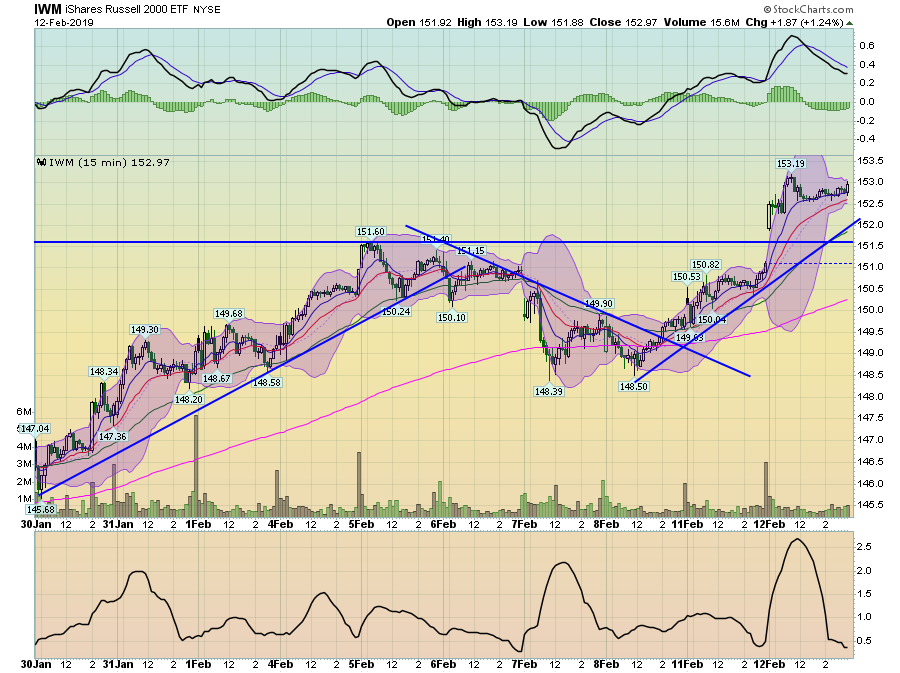
On the 2-week chart, the IWM has rallied, sold off, and then rallied again. This is a very healthy chart; it indicates that the buyers are taking profits and waiting for the right level to move into the market.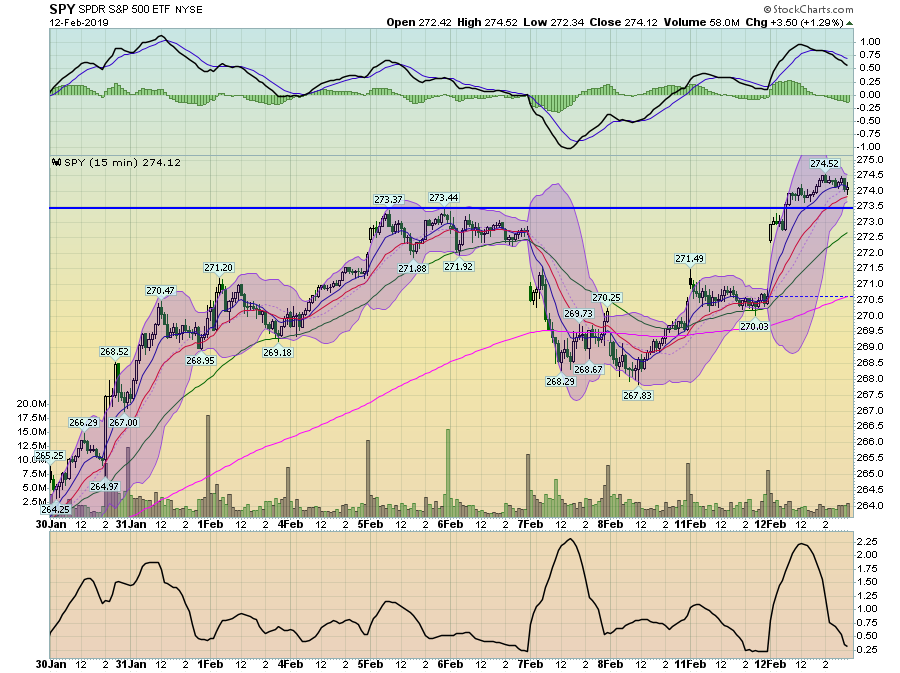
The 2-week SPY chart is less bullish. There is clear upward movement, but the path to get from a low to high is far less evident or pronounced. The one good thing about this chart is prices are near a 2-week high. The bad news is we don't have any really solid trend lines to patterns to lock onto.
Finally, each 30-day chart does have a solid uptrend in place.
Right now, there is plenty to like in the charts. There is clearly a bullish bid in the short-term. And there are generally some solid trends in the longer time frames as well.
Disclosure: I/we have no positions in any stocks mentioned, and no plans to initiate any positions within the next 72 hours. I wrote this article myself, and it expresses my own opinions. I am not receiving compensation for it (other than from Seeking Alpha). I have no business relationship with any company whose stock is mentioned in this article.


